Full Report
The Business of Renting Digital Labor
TaskUs sells outsourced human labor, wrapped in software, to companies that would rather not build and manage large operational teams themselves. A social platform needs thousands of people reviewing flagged posts; a fintech needs agents handling chargeback disputes; an autonomous-vehicle developer needs annotators labeling millions of images to train a model. Business process outsourcing (BPO) is the industry that supplies those people on demand — recruited, trained, housed in delivery centers (mostly offshore), and billed back to the client as a service. The client pays; the client's own end users are served; and the economic organizing principle is labor arbitrage: performing the work where qualified labor is cheaper, plus a layer of specialization, technology, and management the client would find expensive to replicate in-house.
TaskUs organizes this around three service lines — Digital Customer Experience, Trust & Safety, and Artificial Intelligence Services — and ran roughly 65,500 people across 31 sites in 13 countries at the end of 2025 [1]. This tab lays out what the industry sells, where the money and risk sit along the chain, who the players are, the forces that divide the field, and where the cycle stands read from the operators' own quarterly commentary. It does not argue the stock; the named-rival record lives in Competition and this company's own path in History.
What is sold — three service lines
The three offerings share a delivery machine but sell into different buyers and carry different economics. In fiscal 2025 they were 56%, 26% and 18% of TaskUs's $1,183.5 million service revenue, versus 61%, 25% and 14% of $995.0 million in 2024 [2].
- Digital Customer Experience (Digital CX) — the traditional core: handling a client's customer interactions, but weighted toward lower-cost non-voice channels (chat, social, in-app, SMS) rather than phone calls, with an "automation first" posture [3].
- Trust & Safety — content moderation and financial-crime/compliance work: monitoring and reviewing user- and advertiser-generated content against platform policies and law. Demand here is manufactured by regulation and platform risk — governments and cultural norms require online platforms to maintain distinct, constantly updated content policies by geography [4].
- AI Services — human labor that feeds machine learning: data collection and annotation, model evaluation, red-teaming and safety testing across a client's machine-learning lifecycle [5]. This is the fastest-growing line, and the one most directly tied to the AI build-out.
Source: derived from the FY2025 mix (56% / 26% / 18% of $1,183.5M) and FY2024 mix (61% / 25% / 14% of $995.0M) [6].
The three lines trace the industry's own evolution: voice call centers gave way to digital customer care, which the internet platforms extended into content moderation, which the AI wave has now extended into data work for models. TaskUs's mix has been tilting from the mature line toward the newer ones — AI Services rose from 14% to 18% of revenue in a single year.
The value chain — where revenue, risk, and profit sit
The chain is short and labor is the pivot. A client (typically a technology company) hands off a process; the BPO recruits, trains, and manages the workforce that performs it, mostly in lower-cost geographies; the workforce serves the client's end users; the client pays a fee, generally with contractual volume minimums and maximums, on nonexclusive contracts that often include termination-for-convenience clauses [7].
Source: TaskUs client-contract terms and competition, FY2025 10-K [8] [9].
The defining number of the whole industry is the labor line. For fiscal 2025, payroll and related costs were about $782 million, or 66% of TaskUs's revenue [10]. A BPO is, financially, a spread business: the gap between what a client pays and what the delivery workforce is paid, minus facilities and management. That makes two variables structural — the wage the provider pays, and the price the client will bear — and puts the provider in a squeeze whenever wage inflation runs ahead of its ability to reprice [11].
Geography is the arbitrage
The spread is manufactured by placing the work offshore. Utilizing primarily offshore and near-shore markets is a stated central tenet of the delivery model, and the Philippines is by far the largest hub — about 38,100 people, or 58% of headcount at the end of 2025 [12]. Measured by where the revenue is produced, the Philippines generated $638.0 million of 2025 service revenue, India $153.8 million, the United States $132.1 million, and the rest of the world the balance [13].
Source: FY2025 Annual Report, Item 1 Business — delivery footprint (approximately 65,500 people worldwide) [14].
Concentrating labor in a few low-cost jurisdictions is what creates the margin, but it also concentrates the risk: local minimum-wage law, currency moves, and single-country dependence all land on the delivery footprint. TaskUs's filings name wage inflation and statutorily mandated minimum-wage increases as direct threats to profitability [15].
Market size — large, but the public numbers are dated
The most-cited sizing of this market comes from TaskUs's 2021 IPO registration, which put the aggregate opportunity at "over $100 billion" across its three offerings [16]. The components, each with its own as-of date, were:
Source: Form S-1/A "Market Opportunity" — IDC (customer care $77B in 2020; AI services $18.4B in 2020 growing to $37.8B by 2024), JC Market Research (content moderation $5.3B in 2020) [17].
Two cautions belong on every one of these figures. First, they are 2020-vintage estimates from a marketing document written to support an IPO, and the corpus contains no refreshed, independent sizing — treat them as an order-of-magnitude backdrop, not a current TAM. Second, the segments are defined by TaskUs and drawn from different research houses (IDC, Everest Group, JC Market Research) on different base years, so they are not additively clean. What the numbers do establish directionally is the shape the company was betting on: a large, slow-moving customer-care pool, a smaller but faster-growing content-moderation pool, and an AI-services pool projected to roughly double from 2020 to 2024 [18].
The players — a fragmented field of pure-plays and giants
TaskUs describes its arena as "a large, rapidly changing, and fragmented global market" spanning onshore, nearshore and offshore BPO providers, IT-services firms, consulting firms, and — importantly — its target clients' own in-house operations [19]. Its IPO filing named the same structure — highly competitive, highly fragmented, competing against large multinational providers, low-cost offshore providers, niche specialists, and clients' in-house functions [20]. Neither document names specific rivals, but the company's own peer disclosures do.
The genuine like-for-like peers are the pure-play digital-CX / BPO operators. When TaskUs's advisers benchmarked its valuation, the public comparables they used were Teleperformance, Concentrix, and IBEX [21] — joined in the industry by TTEC, TELUS International, and the offshore process specialists Genpact, WNS and ExlService. These are the firms that run TaskUs's model at similar or larger scale.
A note on the peer data in this run: the automatically screened comparison set is IBM, Accenture, Cognizant, Fiserv, FIS and CDW. Only three of those are even partly comparable — Accenture, Cognizant and IBM each operate a business-process-outsourcing / digital-operations arm — and they are 18-to-59 times TaskUs's size, so they read as the scaled IT-services adjacency rather than direct competitors. Fiserv, FIS and CDW are payments-technology and IT-hardware businesses with no customer-experience or content-moderation operations, and are not comparable. The table below therefore benchmarks TaskUs against the adjacency peers that the dataset supports, with that caveat stated plainly.
The read across the field is that TaskUs grew revenue markedly faster than the larger services firms in 2025 (19.0% versus a peer median near 7%) while running a thinner operating margin (11.9% versus a median above 15%) — the profile of a smaller, faster-growing specialist rather than a mature scaled processor. Because the pure-play CX peers are not carried in this run's financial data, a full like-for-like margin comparison against Teleperformance or Concentrix is not possible here; that comparison is developed in Competition.
Structural forces — what divides the field
Five forces do most of the dividing in this industry. The first two bear directly on who captures the spread.
Sources: client concentration and competition, FY2025 10-K [22]; payroll and wage risk [23]; AI framing [24]; regulation-driven Trust & Safety [25]; vendor consolidation [26].
Buyer power is the sharpest edge. Contracts are nonexclusive and generally cancellable for convenience, and revenue is concentrated: TaskUs's top 10 clients were 58% of 2025 revenue, its top 20 were 71%, and its single largest client, Meta, was 26% [27]. Concentration has been rising, not falling — by the first quarter of 2026 the top 10 reached 63% and the top 20 reached 75% [28]. A large client can also become a competitor by pulling work back in-house, since one of the named alternatives to hiring a BPO is the client's own operations [29].
Source: FY2025 Annual Report, Item 1 Business — Our Clients [30].
Where the cycle stands — read across quarters and companies
BPO demand is cyclical, and the industry has just been through a full cycle that the operators narrated in real time. The path is clearest when read oldest to newest.
The 2023 downturn. TaskUs's own chairman called 2023 "the most challenging year in the history of TaskUs," naming three forces at once — competitor consolidations, client cost optimizations, and the rise of generative AI [31]. It was an industry event, not a company-specific one: in the second quarter of 2023 management described "challenging market dynamics and a slowdown in client volumes," and revenue fell 7.0% year over year [32]. Full-year 2023 revenue declined 3.8%.
The 2024–2025 recovery. Growth returned and then reaccelerated: TaskUs reported its highest quarterly revenue in company history and a return to double-digit growth of 13.2% in the third quarter of 2024 [33], and framed this against peers who were struggling — "we've watched many of our competitors struggle to deliver growth and reduce their guidance … they are now playing defense as TaskUs continues to take share" [34]. It quantified the share-taking: "tens of millions of dollars of business from our direct competitors across 48 clients, including 13 of our top 20 clients" [35]. Full-year 2025 revenue grew 19.0%.
Source: reported revenue growth, FY2021 +59.1%, FY2022 +26.3%, FY2023 −3.8%, FY2024 +7.6%, FY2025 +19.0% (company filings, as reported).
The AI turn (2025–2026). The current pressure is different in kind from 2023's macro squeeze. By late 2025 management described a fresh, AI-driven slowdown across the sector: "Growth across the BPO industry has slowed as clients aim to reduce their costs by leveraging Generative AI to automate workflows previously done by employees and outsourced vendors" [36]. This is the same force cutting both ways that the field now organizes itself around, discussed next.
Industry currents that matter for TaskUs
Three currents run through the primary record. They are stated here as observed conditions, not as a judgment on the company.
1. Generative AI is genuinely double-edged. Management's framing is that the industry "will have both winners and losers," with providers focused on "simple, repeatable customer interactions and processes" set to be "automated into oblivion," while those doing more complex work and building AI-support revenue can keep growing [37]. Both edges are visible in TaskUs's own numbers: its largest client's automation efforts have slowed Trust & Safety volumes, with some of that revenue shifting into the AI Services line [38], even as AI Services grew 36.1% in the first quarter of 2026 — a sixth consecutive quarter above 30% [39]. The industry-wide response is a business-model shift the operators describe openly: "we must shift from selling time-based services to selling solutions delivered by a combination of technology and talent" [40] — a move away from billing hours toward billing outcomes.
2. Client cost pressure and vendor consolidation. The 2023 downturn was driven by clients optimizing costs, and the subsequent recovery has been shaped by clients trimming vendor rosters — "pretty aggressive vendor consolidation across our biggest customers" — which redistributes volume toward the providers clients decide to keep [41]. Consolidation is a two-sided force for the field: a share gain for the retained vendor, a share loss for the dropped one.
3. Offshore labor economics. Because payroll is roughly two-thirds of revenue [42] and delivery is concentrated in a handful of offshore hubs led by the Philippines [43], the entire field's margin is a wager on wages staying low and repricing staying possible. Geographic mix shift — moving work toward lower-cost geographies — has been the industry's standard lever for defending margin through the cycle, and remains the counterweight to both wage inflation and pricing pressure.
Reading the cycle as a whole: the industry passed through a demand trough in 2023, recovered on volume and share gains through 2024–2025, and now faces a structurally different pressure in which generative AI simultaneously erodes commoditized volumes and creates new AI-data demand. All three of these are drawn from operators' own quantified commentary across quarters.
Competition
TaskUs sells outsourced digital work in a market it calls "large, rapidly changing, and fragmented." Its own filing defines the field as "onshore, nearshore and offshore business process outsourcing providers, information technology service providers, consulting firms, and our target clients' in-house operations" [1]. Two features of that field organize this tab. First, the company states plainly that its "services and solutions may easily be replicated by our competitors, and our services can be moved from one provider to another" [2]. Second, TaskUs names no rival — not in five annual reports, not on its calls. Competitors appear only as categories.
The evidence base here is TaskUs's five 10-Ks (FY2021–FY2025) and its earnings calls, read against the six filers the industry screen staged as peers — Accenture, Cognizant, IBM, Fiserv, FIS and CDW. That screen is a market-cap-and-sector match, not a business-model match: the genuine rivals a moat argument would need — Concentrix, Teleperformance, TTEC, IBEX, Genpact, WNS — are not in this corpus. This tab maps who overlaps where, lays the confirmed rivals' numbers beside TaskUs's, and records where share, pricing and contract terms are actually moving. The arena's structure and value-chain economics belong to Industry; the raw source shelf is Competitors.
The arena in TaskUs's words
Across every filing since the IPO, TaskUs describes the same fragmented field and the same competitor categories. The wording tightened over time — FY2024 added "nearshore" to the mix — but the substance held: multinational service providers, lower-cost offshore providers, IT-services firms, consultancies, and the clients' own in-house teams [3]. The company's stated point of difference is focus: it argues that "most of our competitors view technology as one of their many client verticals," whereas TaskUs built around high-growth technology clients [4].
The overlap with the staged peer set is uneven. TaskUs runs three service lines — Digital Customer Experience, Trust & Safety, and AI Services — delivered by roughly 65,500 people across 31 sites in 13 countries [5]. Only two of the six screened filers touch that work at all; the other four sit on the opposite side of the transaction.
Sources: overlap read from each filer's own FY2025 10-K — Accenture Operations and Song [6] and content-moderation disclosure [7]; Cognizant "business process services and automation" [8]; IBM BPO within Consulting [9]; Fiserv payments technology [10]; FIS lists BPO firms as competitors [11]; CDW reseller model [12] and its own BPO outsourcing [13].
Vetting the peer screen
The two adjacencies are Accenture and Cognizant, and both are far larger, consulting-led firms where TaskUs-type work is a small, undisclosed slice. Accenture is the only filer in the set that discloses the specific work TaskUs does: its Operations dimension operates "business processes on behalf of clients … including … platform trust and safety, banking, insurance, network and health services" [14], and it flags content moderation as an employee-welfare and litigation risk in the same terms TaskUs uses [15]. But Accenture booked $69.7 billion of revenue with about 779,000 employees in FY2025 [16] [17], and does not break out the CX or moderation slice. Cognizant is the closest match on offering mix — it runs a business-process line described as "business process services and automation" [18] and reported $21.1 billion of revenue and about 351,600 employees, 256,900 of them in India [19] [20]. Neither firm discloses the segment cleanly enough for a like-for-like margin comparison.
The other four run a different model, and each says so in its own filing. IBM keeps BPO only inside Consulting and names Accenture and Capgemini — not TaskUs — as its competitors [21]. Fiserv is a payments-technology processor [22]. FIS lists "business process outsourcing companies" as its own competitors, not its business [23]. CDW is an IT reseller that itself "outsourced certain business processes to third-party outsource partners … including offshore partners" [24] — a buyer of the service TaskUs sells. Those four are excluded from the like-for-like economics below.
Rivals' numbers beside TaskUs's
Even the two adjacencies dwarf TaskUs. On FY2025 revenue, TaskUs at $1.2 billion sits roughly one to sixty against the screened set — the reason "share" against these names is not a like-for-like contest.
Source: FY2025 annual filings, as reported — TaskUs $1.18B [25]; Accenture $69.7B [26]; Cognizant $21.1B [27]; remaining peers as reported.
Where TaskUs stands apart is growth and capital intensity. It grew revenue 19.0% in FY2025 against a screened-peer median near 7%, but it runs a labor-heavy model: capital expenditure was 5.4% of revenue versus a peer median of 1.4%, and its FY2025 free-cash-flow margin of 6.2% sits below the peer median of 14.0%. These are the facts-floor comparison figures; peers reporting different segments are not strictly comparable on operating margin.
Source: synthesis of reported FY2025 financials across the six-peer set (medians as computed); dash = not comparable/undisclosed. Growth and margins as reported in company filings.
The revenue path shows the divergence over five years: TaskUs re-accelerated to 19% growth in FY2025 while the two adjacencies grew in the mid-single digits.
Source: TaskUs FY2021–FY2025 10-Ks, as reported [28]; Accenture and Cognizant revenue as reported in their FY2025 filings [29] [30].
Client concentration and the service-line shift
The competitive fact that most shapes TaskUs is not a rival but a customer. Its largest client — Meta — has supplied between a fifth and a quarter of revenue every year since the IPO: 27% in FY2021, easing to 19% in FY2023, then climbing back to 26% in FY2025 [31] [32] [33]. Quarterly, the concentration peaked at 27% in the third quarter of FY2025 before rolling off to 24% in the first quarter of FY2026 [34] [35].
The year-by-year Meta trajectory (FY2019–Q1 FY2026) is charted in History, which owns the dated client record.
The service mix has rotated as the market shifted. Digital Customer Experience — the seat-based voice-and-chat core most exposed to automation — fell from 64% of service revenue in FY2021 to 56% in FY2025, while Trust & Safety rose to 26% and AI Services reached 18% [36] [37]. AI Services crossed $200 million of revenue in FY2025 and was the fastest-growing line [38].
Source: TaskUs 10-Ks — FY2021 64/22/14 [39]; FY2022 66/19/15 [40]; FY2023 66/20/14 [41]; FY2024 61/25/14 [42]; FY2025 56/26/18 [43].
The delivery footprint that lets TaskUs price offshore has also diversified. The Philippines still holds the largest share of headcount but fell from 68% of employees in FY2021 to 58% in FY2025, while India rose to 13% of revenue and US onshore delivery dropped to 11% [44] [45]. That same low-cost geography is what the company says gives it a "competitive advantage" it warns "may disappear altogether" if labor economics shift.
Where share and pricing are moving
TaskUs's clearest claim of taking share is management's, not a disclosed number. On the FY2024 year-end call the CEO said the firm had won "tens of millions of dollars of business from our direct competitors across 48 clients, including 13 of our top 20 clients" [46], echoing a similar takeaway a year earlier [47]. These are characterizations; the checkable counterpart is that revenue from clients other than Meta grew about 11–13% through FY2025 and into FY2026 [48].
On pricing, the disclosures point one way: down. The FY2024 MD and A records "an increase in pricing pressure as our clients remain focused on cost reduction and competitors reduce their rates" [49], and on the Q2 FY2024 call the CEO attributed it to "competitors who have excess capacity" cutting rates [50]. TaskUs bills on a mix of bases — "time-and-materials, cost-plus, unit-priced, fixed-price, or outcome oriented" — and is steering clients toward outcome-based pricing where AI handles volume [51].
The AI thread runs through both sides of the ledger. Management concedes that "growth across the BPO industry has slowed as clients aim to reduce their costs by leveraging Generative AI to automate workflows" [52], and warned that "BPOs that remain focused on simple, repeatable customer interactions and processes will be automated into oblivion" [53]. The exposure is now specific: TaskUs disclosed that its largest client "has signaled they intend to leverage AI to drive efficiencies across their organization in 2026" [54], and that "Trust and Safety growth rates have slowed because of our largest client's automation efforts" [55]. The company's answer is to invest — more than $25 million on AI transformation and emerging growth in 2026 — and to reprice toward a single fee per resolved contact rather than per human seat [56] [57].
The switching arithmetic
TaskUs's own filings describe contracts that are easy to leave. Engagements typically run "one to three years in length with automatic renewal provisions," but include "termination at the client's convenience with advance notice," and TaskUs is "generally … not our clients' exclusive outsourcing provider" with no "long-term commitments from clients" [58]. No client has signed a non-compete, clients are free to insource, and some contracts carry no minimum-volume commitment [59]. By FY2025 the disclosure was blunter still: clients can terminate "with or without cause, including for convenience, or opt for month to month contracts" [60].
Sources: TaskUs FY2021 10-K contract terms [61] and insourcing/non-compete [62]; FY2023 MSA fee bands [63]; FY2025 month-to-month terms [64]; portability [65].
What offsets those thin terms is not contractual lock-in but operational entanglement. TaskUs disclosed that it "supported 83 clients from more than one geography, an increase of 32% year-over-year" in FY2024 [66], and the number of clients using more than one service line rose to 73 in FY2025 [67]. Net revenue retention — the practical measure of how much a cohort spends the following year — was 141% at the IPO, fell to 102% in FY2024 as growth stalled, and recovered to 113% in FY2025 [68] [69]. New-client wins have slowed alongside: 34 new logos at a 36% win rate in FY2025, down from 49 wins and a 49% rate in FY2021 [70]. TaskUs cautions that these retention and win-rate figures "should not be viewed as leading indicators of our revenue" [71].
What rivals say about the turf
Read across the peer filings, the striking thing is silence: none names TaskUs, and only one — Accenture — even describes the specific work. The record instead shows where each firm sits relative to TaskUs's field.
Sources: Accenture Operations and content moderation [72] [73]; Cognizant BPS [74]; IBM Consulting/BPO [75]; FIS competitor list [76]; CDW outsourcing disclosure [77].
The competitive record, then, is a specific one: a fragmented field TaskUs leads no measurable share of, a customer base concentrated in one name that is now automating, contract terms that let clients leave on notice, and a service mix rotating toward AI-adjacent work faster than the seat-based core is shrinking. The named rivals that would complete this picture are absent from the corpus; where the moat argument needs them, it will have to source them directly.
The record in brief
TaskUs has a short public life with sharp breaks. Bryce Maddock and Jaspar Weir co-founded the outsourcer in 2008 [1]; Blackstone-affiliated funds bought it in October 2018 [2]; the company listed on Nasdaq in June 2021 [3]. What follows is a dated record of four things: the arc of events, what management guided versus what it delivered, how it allocated capital, and how its explanation of two problems — the 2023 revenue decline and the automation of its own work by AI — changed over time. The single defining event of the recent record is a take-private bid by the founders and Blackstone that the company's own minority shareholders rejected in October 2025 [4].
Who controls and runs TaskUs today, and its present governance, belong to People; the named-rival and market-share record belongs to Competition. This tab keeps the dated ledger.
FY2025 Revenue ($M)
FY2025 Revenue Growth
Net Debt, FY2025 ($M)
Market Cap, Jul 2026 ($M)
Source: reported financials, FY2025 10-K and market data as of 2026-07-31; revenue and net debt as reported [5].
Dated beats
The events that define TaskUs, in sequence. Uneventful stretches are compressed; the said-versus-did ledger below accounts for every covered year.
Sources: Final Prospectus (424B4, Oct 2021) [6]; FY2021 annual report [7]; FY2025 10-K [8]; take-private announcement [9].
Founding, ownership, and the IPO
TaskUs traces its revenue to a 2008 launch by Maddock (chief executive) and Weir (president) [10]. Its current corporate form dates to the Blackstone Acquisition of October 1, 2018, when funds affiliated with Blackstone bought the business through a new vehicle [11]. Before the IPO, the owners took cash out twice: a $135.0 million dividend in October 2019 [12] and a $50.0 million ($0.55 per share) dividend declared in April 2021, weeks before listing [13].
The IPO priced at $23.00 per share; TaskUs issued 5,553,154 primary shares and selling stockholders sold 9,626,846 secondary shares, with trading beginning June 11, 2021 [14]. The company adopted a dual-class structure: after the offering, high-vote Class B stock held by Blackstone and the co-founders carried roughly 96.3% of the voting power, making TaskUs a Nasdaq "controlled company" from day one [15]. Four months later, insiders sold again: an October 2021 secondary of 12,077,480 Class A shares at $63.50 — nearly triple the IPO price, against an October 20 close of $64.36 — from which the company received no proceeds [16].
At the IPO, TaskUs organized around three service lines — Digital Customer Experience, Content Security (later Trust and Safety), and AI Operations — and disclosed heavy client concentration: the top ten and twenty clients were 68% and 81% of 2020 revenue, and the largest client, Facebook (now Meta), was 32% [17]. That single-client dependence is the thread that runs through the entire record below.
The financial arc
Revenue compounded fast, stalled once, then re-accelerated. FY2021 grew 59.1% to $760.7 million; FY2022 grew 26.3% to $960.5 million [18]; FY2023 then declined 3.8% to $924.4 million — the first annual contraction as a public company [19]. Growth returned to 7.6% in FY2024 and accelerated to 19.0% in FY2025 [20].
Source: reported financials, FY2021–FY2025 10-Ks; FY2022 MD and A [21] and FY2023 MD and A [22].
Source: reported financials as reported, FY2021–FY2025 [23].
Operating margin moved the other way from revenue: it turned positive after the IPO-year loss and rose to 11.9% by FY2025 even as revenue swung, because management leaned on an offshore delivery mix and cost control through the downturn.
Management said versus did
TaskUs issued explicit full-year revenue and Adjusted EBITDA-margin guidance each quarter, then revised it. The direction of those revisions is itself a record: in FY2023 the full-year revenue guide was cut at nearly every print; in FY2024 it was raised at every print.
Sources: quarterly earnings releases. FY2023 opened at $940–$990M [24], was cut to $925–$950M [25] then $900–$910M [26], then nudged to $915–$917M [27]. FY2024 opened at $900–$950M [28] and rose to $988–$990M by Q3 [29].
The full guidance-versus-actual ledger, by year and measurement basis:
Sources: earnings releases FY2022–FY2026; FY2025 outlook set at $1,095–$1,125M [30], reinstated at $1,173–$1,175M after the deal collapsed [31], and FY2026 opened at $1,210–$1,240M [32].
Two features stand out. Management's Adjusted EBITDA-margin guidance held or rose even while FY2023 revenue guidance fell — the downturn was met by protecting profitability, not chasing volume. And the FY2026 guide of roughly 3.5% growth, set in February 2026, marks a self-described deceleration after a 19.0% year, which management attributes to its largest client automating work (see below) [33].
Explanation drift I — the 2023 decline
How management accounted for the same problem — softening client volumes — shifted from a growth frame to a macro frame to a structural frame within eighteen months.
Aug 2022 — "our differentiated global footprint and automation capabilities position us well to continue to win competitive deals and grow faster than the market in both 2022 and beyond." [34]
Feb 2023 — "We expect volumes will continue to grow faster offshore than onshore, setting us up well for healthy growth in the back half of 2023 and beyond." [35]
May 2023 — "we see continued volatility in the macro environment and have updated our ful year outlook to reflect this." [36]
Aug 2023 — "the industry saw challenging market dynamics and a slowdown in client volumes in the second quarter." [37]
The FY2023 10-K settled on a structural explanation absent from the early-2023 optimism: clients "increased their focus on cost reduction," shifting work from onshore to cheaper offshore locations and reducing vendor spend [38]. The "healthy growth in the back half of 2023" promised in February did not arrive; the year finished down 3.8%.
Explanation drift II — AI as threat and opportunity
The second tracked narrative is how AI moved, in management's own telling, from a growth engine to a force automating TaskUs's own work. The FY2023 10-K first named the threat and the opportunity in the same filing: demand for "certain service offerings could decrease" as clients adopt generative AI [39], while the MD and A described embedding its own "TaskGPT" tools across offerings [40].
By early 2025 the framing was confident and binary:
Feb 2025 (Q4 FY2024 call) — "BPOs that remain focused on simple, repeatable customer interactions and processes will be automated into oblivion, while those that provide more complex services … will have the opportunity to achieve durable double-digit growth. … At TaskUs, we intend to be an AI winner." [41]
A year later the record shows the cannibalization arriving at TaskUs itself. The FY2025 10-K disclosed that its largest client's automation initiatives "may ultimately result in the automation of some services that TaskUs currently provides" [42], and by the Q1 FY2026 call management stated plainly that "automation is most materially impacting our Trust and Safety business" [43]. The same technology that drove AI Services past $200 million in FY2025 is now cited as the reason a core service line is slowing.
The Meta dependency, year by year
The largest-client concentration disclosed at the IPO never went away; it fell for three years, then climbed back above its starting level. Facebook/Meta ran from 32% of 2020 revenue to 19% in FY2023, then rose to 26% by FY2025 [44].
Sources: FY2021 10-K (Meta 27%, DoorDash 11%) [45]; FY2023 10-K (19%) [46]; FY2025 10-K (26%) [47]; Q1 FY2026 call (24%) [48]. FY2019–FY2020 figures as disclosed at IPO [49].
The rebound in concentration and the automation of that same client's Trust and Safety work are the two facts that most directly shape the FY2026 guidance.
Capital allocation
TaskUs made no acquisitions across its public life — cash used for acquisitions was zero in every year FY2021–FY2025. Capital allocation was therefore dividends to pre-IPO owners, buybacks, debt service, and, in 2026, a debt-funded special dividend. Secondary offerings recur throughout, but they moved shares from insiders to the market and brought the company no cash.
Sources: dividends and buybacks as reported. Pre-IPO dividends [50]; buyback amounts FY2022–FY2025 per the 10-K share-repurchase notes [51]; FY2026 special dividend of $3.65/share (~$333M) [52].
Buybacks. The board authorized a first $100.0 million repurchase program in September 2022 [53], doubled it to $200.0 million in May 2023 [54], and let it expire on schedule at the end of 2025 [55]. The bulk was spent in one year: FY2023 saw 10,146,692 shares bought for $111.8 million, at a much lower average price than the modest buying in other years [56].
Debt. TaskUs ran a $270.0 million term loan from the September 2022 refinancing, maturing 2027, priced at adjusted SOFR plus 2.25% [57]. It then deleveraged steadily — net debt fell from $174.8 million at FY2021 to $29.7 million at FY2025 — before reversing course. In March 2026 the company signed a new $500.0 million term loan and $100.0 million revolver, at a higher SOFR-plus-2.75% margin, to refinance the 2027 maturity and fund the special dividend [58].
The 2026 special dividend, read against 2025. Having failed to take the company private at $16.50, the founders and Blackstone — still the controlling holders — declared a $3.65-per-share special dividend in February 2026, about $333 million, funded by new borrowing and balance-sheet cash [59]. It was the first dividend of any kind since the pre-IPO distributions of 2019 and 2021.
Secondary offerings. Beyond the October 2021 secondary, a July 2024 resale prospectus registered 70,032,694 Class A shares for the Blackstone sponsor and the co-founders; again, the company received no proceeds [60].
Litigation on the record
The post-IPO share collapse drew a securities class action, Lozada v. TaskUs, filed in February 2022 against the company and its senior officers, alleging the IPO registration statement and 2021 earnings calls were misleading [61]. The suit survived a partial motion to dismiss and, in early 2025, was settled for a combined $17.5 million, expected to be insurance-funded [62]; the court granted final approval in December 2025 [63]. A separate 2025 derivative suit, Eaton v. Maddock, alleges the pre-IPO filings misstated TaskUs's "low employee attrition rate and high Glassdoor rating" [64] — a direct challenge to the workforce-culture story TaskUs sold at listing. TaskUs also carries a standing content-moderation risk that its Trust and Safety workers may develop stress disorders and "create liabilities for us" [65].
The take-private that shareholders rejected
The defining event of the recent record is a founder-and-sponsor buyout that failed at the shareholder vote — an unusual outcome for a controlled company.
Sources: take-private announcement, $16.50/share, ~26% premium, Special Committee formed Mar 20 2025 [66]; FY2025 outlook withdrawn [67]; adjournment and majority-of-minority requirement [68]; no price amendment offered [69]; vote failure and termination [70].
The mechanics that decided it are on the record. Approval required "the affirmative vote of a majority of votes cast by stockholders excluding the Buyer Group" — a majority-of-the-minority — and by late September that vote "had not been obtained" [71]. Through two adjournments the Buyer Group made no proposal to raise the $16.50 offer [72]. On the October 8 meeting the shareholders declined; the next day the parties terminated the deal by mutual agreement. The chief executive's own account named the reason:
"The buyer group used this time to have multiple discussions regarding the level of price increase required to obtain the approval of certain shareholders, who believe that the $16.50 offer price undervalued the company. Ultimately, we did not obtain the necessary shareholder vote, because the valuation gap persisted." [73]
The FY2025 10-K records the same event in its risk factors: in October 2025, "as a result of failing to receive stockholder approval," TaskUs terminated the merger agreement dated May 8, 2025 with Breeze Merger Corporation, the acquisition vehicle for the sponsor and co-founders [74]. Four months after the offer that insiders called fair, the same insiders paid all shareholders a $333 million special dividend and re-levered the balance sheet to do it — two capital events the record places side by side without reconciling them.
Control and Incentives at a Glance
TaskUs is a controlled company. A dual-class structure hands its pre-IPO owners — Blackstone and co-founders Bryce Maddock and Jaspar Weir — roughly 96.9% of the combined voting power while they hold a smaller share of the economics [1]. Under Nasdaq rules the company claims the exemptions available to a controlled company, including the right to operate without a majority-independent board or a fully independent compensation committee [2].
That control has one documented limit. In 2025 the same insiders tried to take the company private at $16.50 a share; the deal carried a majority-of-the-minority condition, the unaffiliated holders voted it down, and the merger agreement was terminated on October 9, 2025 with no fee paid [3]. This tab records who controls the company, who runs it, what they are paid to do, and the dated governance facts behind the current structure. The operating model that generates the incentive metrics is covered in Business; the multi-year record of what management said versus did is in History.
Votes Versus Economics
Class A common stock carries one vote per share; Class B common stock carries ten [4]. Blackstone and the two founders hold all of the Class B, so a minority of the economics translates into near-total voting control. As of March 1, 2026 there were 35,528,558 Class A and 55,032,694 Class B shares outstanding [5].
Source: economic split derived from share counts in the 2026 Proxy Statement beneficial-ownership table; voting-power percentages as disclosed [6].
The wedge is widest for the largest holders. Blackstone holds roughly 52% of the economics but 64.9% of the votes; the two founders together hold about 30% of the economics and 32% of the votes [7]. The mirror image sits with the largest outside holder: Think Investments held about 10.5% of the Class A economics but, owning no Class B, under 1% of the vote [8]. A public holder buying Class A today buys cash-flow exposure and almost no say over the ballot.
Source: 2026 Proxy Statement, beneficial-ownership table; economic column derived from disclosed share counts [9].
The Share-Class Clock
The Class B structure is not permanent. Each Class B share converts to Class A one-for-one on the earlier of a fixed sunset date — June 10, 2028, seven years after the IPO certificate took effect — or the point at which the Sponsor's or a founder's Class B ceases to represent at least 5% of outstanding shares; any transfer outside a permitted list also converts the shares automatically [10]. Until then, the founders and Blackstone keep majority control so long as their Class B represents at least 9.1% of all outstanding shares [11]. The charter authorizes 2.5 billion Class A and 250 million Class B shares, so there is ample room to issue Class A without touching the control block [12].
The dual-class sunset lands on June 10, 2028. Absent an earlier trigger, super-voting Class B collapses into one-share-one-vote on that date, and voting power would move toward economic ownership.
What the Stockholders Agreement Locks In
Beyond the raw votes, a stockholders agreement signed at the IPO gives Blackstone graduated board-nomination rights that scale with its stake — from a majority of the board while it holds 50% or more of the common stock down to at least one designee while it holds between 5% and 20% [13]. Each founder group may name one director while it holds at least 5% [14]. While those thresholds hold, the company may not take a set of major actions — related-party deals with the Sponsor or founders, most securities issuances, distributions, a bankruptcy or dissolution, or charter amendments that disproportionately hurt those holders — without the written consent of Blackstone and at least one founder [15]. Two of the current directors — Mukesh Mehta and Amit Dalmia — are Blackstone designees under this agreement [16].
The 2025 Take-Private and Its Defeat
The clearest test of who can influence what came in 2025. Blackstone and the founders — the "Buyer Group" — moved to buy out the public holders and take TaskUs private through a merger vehicle, Breeze Merger Corporation, funded by a Blackstone equity commitment of up to $330 million [17]. Public shares would be cashed out at $16.50; the founders' and Blackstone's shares would roll over and stay outstanding [18]. The $16.50 price was a premium of about 14.7% over the $14.38 close on the day before signing [19].
Because the buyers are conflicted controllers, the board routed the deal through a special committee of three independent directors — Michelle Gonzalez, Kelly Tuminelli, and Jacqueline Reses — advised by Evercore and Cravath, Swaine and Moore; each member was paid $100,000 for the service [20]. Evercore opined the $16.50 was fair; its discounted-cash-flow analysis on the company's base case implied a value range of $12.40 to $20.20 per share [21].
For the dated deal chronology, see History; for the price-negotiation and reservation-price detail ($16.00 → $16.75 → $16.25 → $16.50), see Controller Alignment.
The founders and Blackstone had signed voting agreements committing their shares, so approval was assured on every threshold except one: a separate majority of the votes cast by the public, unaffiliated stockholders [22]. That vote failed, and not narrowly.
Public shares voted FOR
Public shares voted AGAINST
Source: the majority-of-the-minority tally was 840,473 shares for versus 10,064,296 against among public stockholders; the merger agreement proposal did not receive the requisite approval [23].
The mechanics are worth recording plainly. On matters decided by raw voting power, the controllers decide. On this transaction, the deal structure — chosen to withstand later legal challenge — gave the minority a real veto, and the minority used it. Had the deal instead terminated for a superior proposal, the company would have owed a $39 million termination fee; because it died on the shareholder vote, no fee was payable [24].
One incentive detail survived the failed deal. In connection with the merger, CEO Bryce Maddock's June 2024 performance units were amended to replace stock-price-CAGR goals with adjusted-EBITDA and revenue goals, and to add vesting protection on a termination without cause [25].
Board and Committees
After the May 2026 annual meeting the board has eight members. Two are the founder-executives; two are Blackstone employees serving as Sponsor designees; the remaining four are outside directors. The proxy determines that every committee member — including the Blackstone-employed directors on the compensation committee — qualifies as an independent director under SEC and Nasdaq rules [26]. Jill Greenthal has served as lead independent director since March 2023 [27]. Maddock chairs the board while also serving as CEO.
Source: 2026 Proxy Statement, director nominees and committee membership [28]; Blackstone designee status [29].
Two facts sit side by side without a verdict attached. As disclosed, the board designates every committee member independent, and the audit committee has two audit-committee financial experts in Tuminelli and Greenthal [30]. As observed, two of the eight directors draw their primary pay from the controlling shareholder, and a third — Greenthal, the lead independent director — is a former Blackstone senior managing director. Jacqueline Reses, who chaired the compensation committee and sat on the take-private special committee, resigned effective at the 2026 annual meeting; the company recorded no disagreement [31].
Operators
The two founders run the company: Bryce Maddock as CEO and chairperson, Jaspar Weir as president, both directors since 2018 [32]. Below them, the finance seat has turned over repeatedly.
Sources: Sekar as CFO and the executive-officer roster in the 2026 Proxy Statement [33]; Khemka's appointment succeeding Thrash [34].
Two operators changed hands in roughly three months of 2026: an interim CFO in March, then a permanent CFO, Rishabh Khemka, effective June 19, 2026 [35]. The prior CFO, Balaji Sekar, had held the role since the IPO and was one of the officers named in the IPO-era securities litigation discussed below. The chief accounting officer and treasurer, Steven Amaya, resigned in December 2024, effective February 2025, to pursue other opportunities [36]. The chief operating officer, Stephan Daoust, has held his seat since January 2021 [37].
What Compensation Pays For
TaskUs reports as an emerging growth company, so only three named executive officers appear in the pay tables — the CEO plus two operators — and neither the president nor the CFO is among them [38]. The CEO's package is almost entirely equity: on a nominal 2025 salary of about $48,000, Maddock's reported total was $5.64 million, of which $5.34 million was stock awards [39].
Source: 2026 Proxy Statement, Summary Compensation Table; the "other" column combines non-equity incentive and all-other compensation [40].
Maddock does not participate in the annual cash bonus; his salary was raised from $40,000 to $50,000 during 2025, and about $251,000 of his "all other" compensation was a reimbursement of legal costs tied to the take-private [41]. The annual incentive plan that pays the other officers is scored on two metrics — annual revenue and adjusted EBITDA dollar targets — with target awards set at 100% of salary for the chief customer officer and 60% for the chief operating officer [42].
Long-term equity splits into time-vesting RSUs — 33% on each of the first two anniversaries and 34% on the third — and performance units divided evenly between revenue and adjusted-EBITDA goals measured over three annual periods (2025 through 2027) [43]. The performance units cap at 100% of target — there is no upside above target — and there is no interpolation between the stated achievement levels, so the design is asymmetric: it can pay full or fall to a lower rung, but it does not reward beating the plan [44]. The proxy discloses no clawback policy and no stock-ownership guidelines for executives.
Non-employee directors receive a $60,000 cash retainer and a $180,000 annual equity grant, with committee-chair and lead-director premiums on top; the three special-committee members each earned an extra $100,000 in 2025 for the take-private work, and the two Blackstone-employed directors take no compensation [45].
Insider Activity
The two founders and the operators behave differently in the market. Neither Maddock nor Weir has reported an open-market sale of stock since the IPO; on the Form 4 record their only dispositions are shares withheld to cover taxes when equity vests [46]. Their disclosed beneficial ownership has still fallen — Maddock's from about 39.8% in early 2024 to 29.8% by late 2025 — as the Class B pool shrank through conversions rather than through founder selling [47]. The named officers, by contrast, have filed a steady run of Form 144 sale notices: Steven Amaya noticed 152,374 shares in May 2025, and Jarrod Johnson filed repeated smaller notices through 2025 and early 2026 [48].
Separately, in March 2026 the board declared a special cash dividend of $3.65 per share, returning roughly $333 million to holders — a payout the controlling holders receive pro rata alongside the public float [49]. The capital-allocation record around it belongs to History.
Related-Party Ledger
TaskUs does ordinary-course business with Blackstone portfolio companies. In 2025 it paid $0.6 million for products and services from entities the Sponsor had an interest in and recognized $12.7 million of revenue from such entities; Blackstone transactions under $5 million a year carry standing board pre-approval [50]. When the company refinanced its credit facilities in March 2026, it paid a $1.0 million fee to Blackstone's broker-dealer affiliate for advisory services [51]. The Sponsor and founders also hold demand and piggyback registration rights, the mechanism through which Blackstone has converted and sold Class A stock over time [52].
Officer and Director Docket
TaskUs has carried IPO-era litigation naming its current and former officers. The securities class action Lozada v. TaskUs, Inc., filed in 2022 in the Southern District of New York, named the company, the CEO, the president, and the CFO over IPO-registration and 2021 earnings-call disclosures; the company entered a settlement in February 2025, and the court granted final approval on December 4, 2025 for a combined payment by defendants of $17.5 million [53]. Two derivative suits against current and former board members — Eaton v. Maddock in Delaware and Tucker v. Dixit in New York — remained outstanding as of the FY2025 filing [54]. These are allegations resolved by settlement without admission, not adjudicated findings; the distinction is recorded here, and any judgment left to the chapters.
Business
TaskUs sells human judgment at offshore wages, wrapped in software. In FY2025 it turned $1.18 billion of service revenue into $140.6 million of operating income and $102.3 million of net income, on a workforce of roughly 65,500 people billed to about 200 clients [1][2]. The economics are a cash-wage labor spread, not an equity-funded tech model — a distinction that decides how real the margins are, and it is where this chapter starts.
Revenue (FY2025)
Operating Margin
Net Income
Adjusted EBITDA
Free Cash Flow
Net Debt
Sources: FY2025 10-K, Consolidated Statements of Income [3]; Adjusted EBITDA reconciliation [4]; Free Cash Flow reconciliation [5]; net debt derived from the FY2025 balance sheet [6].
Who pays, for what
TaskUs is paid by large digital companies to run operational work they would otherwise staff in-house. That work is organized into three service lines — Digital Customer Experience (customer care, 56% of FY2025 revenue), Trust & Safety (content moderation and risk, 26%), and AI Services (data labeling and annotation for machine-learning models, 18%) [7][8]. The industry tab defines what each line does operationally; the point for the business itself is that all three sell the same underlying thing — trained people running a client's process on TaskUs's cloud infrastructure — priced in dollars regardless of where the work is performed [9].
Billing follows the work rather than a single meter. Contracts run on "time-and-materials, cost-plus, unit-priced, fixed-price, or outcome oriented" terms [10]. Historically most revenue was effectively per-seat or per-hour; management is now steering newer work toward outcome-based pricing, and some contracts already commit TaskUs to deliver productivity gains — reduced handle or response time — for the client [11][12]. That shift matters because it moves the revenue meter away from headcount, which is the model's own cost base.
Source: FY2025 10-K, Service revenue by service offering [13].
The mix is rotating. AI Services grew 58.6% and Trust & Safety 23.9% in FY2025, while Digital CX — still the largest line — grew only 8.2% [14]. A year earlier Digital CX was 61% of revenue; it is now 56% [15]. The company is becoming less a call-centre operator and more a supplier of moderation and AI-training labor, though the filing does not disclose the relative margin of the three lines — so whether that rotation helps or hurts profitability cannot be settled from the primary record.
Concentration: a few clients, one very large
The customer base is narrow at the top. The largest client was 26% of revenue in FY2025 (up from 22% in FY2024); the top five were 45%, the top ten 58%, and the top twenty 71% [16][17]. That anchor client — identified elsewhere in the record as Meta (competition) — is both the biggest source of revenue and, because it is automating its own moderation, the clearest single risk to it.
The contracts holding these relationships are thin. They typically run one to three years with automatic renewal, but are generally non-exclusive, carry no minimum-volume commitment, and can be terminated for convenience with notice — some are month-to-month [18]. Against that portability, TaskUs points to cross-sell depth: 73 clients now use more than one service line, up 14% year over year, and it added 34 new clients in FY2025 at a 36% new-client win rate [19]. Entanglement, not contract length, is the retention mechanism.
The unit economics: a cash-wage spread
The engine is labor arbitrage. Cost of services — overwhelmingly the wages of frontline staff in the Philippines, India, and elsewhere — was $736.4 million in FY2025, or 62.2% of revenue, and its increase came almost entirely from $108.2 million of additional personnel cost as headcount grew [20][21]. Roughly 54% of revenue is delivered from the Philippines and 13% from India — the low-cost delivery base against which US-dollar billing rates set the spread [22].
Source: FY2025 10-K, Consolidated Statements of Income and Results of Operations [23].
What makes the margins credible is that they are cash margins. Stock-based compensation was $29.7 million in FY2025 — about 2.5% of revenue — and falling, from $52.8 million in FY2023 [24]. More telling, almost none of it sits in the delivery cost base: only $1.1 million of that $29.7 million ran through cost of services, the rest through corporate SG&A [25]. The frontline that generates the revenue is paid in cash wages, so the gap between billing rate and wage is a real spread, not an accounting one — unlike the equity-heavy compensation that flatters many tech-adjacent operating margins.
Operating leverage lives above that spread, in SG&A. Cost of services scales roughly with revenue — more clients need more people — but SG&A rose only 2.2% while revenue rose 19.0%, so SG&A fell from 24.1% to 20.7% of revenue and carried most of the 260-basis-point improvement in operating margin, to 11.9% [26][27]. Two of those points, though, were non-recurring: SG&A carried $11.9 million of transaction costs from the failed 2025 take-private (history) and shed $15.4 million of prior-year litigation cost [28]. The underlying leverage is real but smaller than the headline margin jump implies.
The shape over time: fall and recovery
Revenue compounded from $359.7 million in FY2019 to $1.18 billion in FY2025, but not in a straight line. FY2023 was a genuine decline — revenue fell 3.8% to $924.4 million as the digital clients TaskUs serves cut their own outsourcing budgets — before the business reaccelerated to 19.0% growth in FY2025 [29]. The FY2021 operating loss was an IPO artifact — a one-time surge in stock-based compensation — not an operating failure; the business was cash-profitable before and after.
Source: FY2025 10-K and prior filings; revenue as reported [30].
Source: derived from reported operating income and revenue, FY2019–FY2025 filings [31].
Where the cash went in FY2025
Reported profit and owner cash diverged in FY2025, and the divergence is the most important thing on the P&L this year. Net income rose 123% to $102.3 million and adjusted EBITDA rose to $249.1 million, yet free cash flow fell to $73.7 million — a 6.2% FCF margin, down from 10.0% [32][33][34]. Operating cash flow held roughly flat at $137.2 million; the drop in FCF came from capital spending nearly doubling to $63.5 million as TaskUs expanded sites, and from a receivables build — accounts receivable rose 27.7% against 19.0% revenue growth [35][36]. Management's own conversion metric — adjusted EBITDA to free cash flow — fell from 47.5% to 29.6% [37].
Whether that is a structural reset or a growth-investment trough is unresolved from the filing, which does not split maintenance from growth capex. It is the first question the cash-quality reader will want answered, and the record does not yet answer it — the Financials and Estimates and Cash Conversion chapters take up the operating-cash-flow, capex, and free-cash-flow trend in full.
The balance sheet: near net cash, LBO goodwill
For an investor whose first test is that the chance of insolvency is near zero, the balance sheet is reassuring. Against $241.4 million of total debt — a term loan maturing in September 2027, with a $190 million revolver undrawn — TaskUs held $211.7 million of cash, leaving net debt of just $29.7 million, well under one-eighth of adjusted EBITDA [38][39]. The operating business is light: property and equipment is $95.4 million on $1.05 billion of assets, consistent with a people-and-software model that leases its sites [40].
The one heavy item is history, not operations. Goodwill of $219.5 million and intangibles of $153.5 million — together 35% of total assets — are carried from the 2018 Blackstone leveraged buyout (history), not from operating acquisitions; TaskUs has made no cash acquisitions in any year of the record [41]. Neither has been impaired. A stripped-down, near-net-cash balance sheet keeps the bankruptcy risk that would end the investment case remote, and that is a load-bearing fact for this business.
The question this report is built to answer
At roughly $565 million of market value in mid-2026, TaskUs trades about 68% below its three-year high and near five times forward free cash flow — a former high-growth IPO the market now treats as a structural loser [42]. Yet the business underneath is growing 19%, cash-profitable, near net cash, and controlled by a founder and Blackstone who together own most of the economics (people). The tension between those two facts is the report's spine:
Is TaskUs a durable, cash-generative outsourcing franchise that the market has mispriced as an AI casualty — protected by a near-net-cash balance sheet and owner-operator control — or is the labor-arbitrage engine at its core being automated away, at its own largest clients, faster than its AI-Services line can replace it?
Everything that follows tests one side of that question or the other: how reliably the reported profit becomes owner cash, whether the client relationships are a moat or a liability, what the controllers' actions say about value, and what price the evidence can justify. The forward consensus already assumes the answer is caution — revenue growth of about 4% in FY2026 against 19% delivered — which is precisely the gap a value reader is paid to test.
Financials and Estimates
TaskUs grew revenue from $359.7 million in FY2019 to $1.18 billion in FY2025, a 22% compound rate, and earned money in every year but the IPO year. The record is real, but two facts sit on top of it: free cash flow fell to a five-year low in FY2025 even as profit doubled, and in March 2026 the company borrowed $500 million to fund a $332.8 million special dividend — turning a near-net-cash balance sheet into roughly $339 million of net debt. This tab sets out the three-year numbers and what the coming years are priced to do.
The seven-year track record
Sources: FY2025 Annual Report (Form 10-K), Consolidated Statements of Income [1]; FY2023 10-K [2]; FY2021 10-K [3].
The shape is a growth company that hit a wall and recovered. Revenue nearly tripled from FY2019 to FY2021, dipped 3.8% in FY2023 as demand from technology clients softened, then re-accelerated to a record $1.18 billion in FY2025, up 19.0% [4]. The single loss year, FY2021, was an accounting event rather than an operating one: the IPO triggered a burst of stock-based compensation that pushed operating income to negative $54.3 million on revenue that still grew 59% [5]. Net income more than doubled to $102.3 million in FY2025, though roughly 200 basis points of that year's margin came from non-recurring items — the mechanics are set out in Business.
The stock tells the opposite story. At the July 31, 2026 close, TaskUs carried a market capitalization near $565 million, down 68% from its trailing three-year high; the median peer in its screened comparison group was down 47%. On $102.3 million of FY2025 net income, that is roughly 5.5 times trailing earnings. This is the fallen-star profile in one line: a business whose revenue set a record in the same year its equity sat two-thirds below its high.
Margins recovered; free cash flow did not
Source: derived from reported financials, FY2021–FY2025 10-Ks — Consolidated Statements of Income [6] and Cash Flows [7].
Operating margin climbed to 11.9% in FY2025, its best since the IPO. Free cash flow margin moved the other way, falling to 6.2% — the two lines cross, and the gap is the story of the year.
Source: FY2025 Annual Report (Form 10-K), Consolidated Statements of Cash Flows [8].
Operating cash flow has been remarkably flat — between $137 million and $147 million for four straight years [9]. What moved in FY2025 was capital spending, which jumped to $63.5 million (5.4% of revenue) from $39.1 million, and a receivables build that ran ahead of revenue. Free cash flow fell to $73.7 million, cutting the conversion of adjusted EBITDA ($249.1 million) into cash from 47.5% to 29.6% [10].
Whether this is a trough or a reset is the question a cash-focused reader should hold open; the deeper decomposition is one for its own chapter. Management's own answer, given with FY2026 guidance below, is that the capex year was a peak.
The balance sheet before and after March 2026
Through FY2025 the balance sheet was the safest thing about TaskUs. Cash of $211.7 million nearly matched total debt of $241.4 million, leaving net debt of $29.7 million — about 0.12 times adjusted EBITDA [11]. That is no longer the picture. On February 25, 2026 the board declared a special cash dividend of $3.65 per share, totaling $332.8 million, paid March 25, 2026 and funded by a new $500 million term loan [12] [13].
Sources: FY2025 balance sheet [14]; Q1 FY2026 total indebtedness [15].
Net Debt — FY2025 ($M)
Net Debt / Adj EBITDA — FY2025
Net Debt — Q1 FY2026 ($M)
Net Debt / Adj EBITDA — Q1 FY2026
Source: derived from FY2025 10-K [16] and Q1 FY2026 10-Q [17], against FY2025 adjusted EBITDA of $249.1M [18].
By March 31, 2026 total indebtedness was $491.6 million against cash of $152.3 million — net debt of roughly $339 million, and shareholders' equity roughly halved to $275 million as the dividend cleared retained earnings [19]. Leverage moved from about 0.12 times to roughly 1.36 times adjusted EBITDA. The new term loan carries a floating rate of 6.412% as of quarter-end, which at $491.6 million of debt implies roughly $31 million of annual interest — a real charge against the flat operating cash flow shown above [20] [21].
For a reader who screens for near-zero bankruptcy risk, the important qualifier is that this is not distress leverage. At about 1.4 times adjusted EBITDA, with the term loan not maturing until March 11, 2031 and a $100 million revolver alongside it, the debt is serviceable out of the company's own cash generation, and the refinancing pushed out the 2027 maturities it replaced [22] [23]. What changed is the cushion, not the solvency: the balance-sheet margin of safety that made TaskUs look like a net-cash special situation has been paid out, mostly to the controlling shareholders, and the decision that produced it belongs to the capital-allocation record (History).
Enterprise value tells a different story than the equity multiple. When TaskUs held net cash, its roughly $565 million market value was about 2.4 times adjusted EBITDA on an enterprise basis. After the debt-funded dividend, adding roughly $339 million of net debt lifts that to about 3.6 times — the equity looks cheaper than the business does.
What the next two years are priced to do
Management's guidance and sell-side consensus agree on the direction: growth slows to low single digits, and reported earnings step down before they recover.
FY2026 Revenue — Guidance Midpoint ($M)
FY2026 Adj EBITDA Margin — Guided
FY2026 Adjusted FCF — Guided Midpoint ($M)
Source: Q1 FY2026 earnings release, Full Year 2026 Outlook [24].
For FY2026 the company guides revenue of $1.210 billion to $1.240 billion — a 3.5% increase at the midpoint — with an adjusted EBITDA margin of about 19.0%, below the 21.1% it posted in FY2025 [25]. Notably, management guides adjusted free cash flow up to $105–$115 million, built on expected operating cash flow near $160 million against capex of about $50 million — its own signal that FY2025's $63.5 million capex year was a peak, not a new run-rate [26]. The first quarter supported the guide: revenue of $306.3 million beat the top of the range by $8.3 million, at a 19.1% adjusted EBITDA margin [27].
Source: consensus estimates (8 analysts) and reported FY2025 results, as reported; adjusted EPS is a non-GAAP figure and is not comparable to the $1.10 GAAP diluted EPS in the statements.
Consensus places revenue growth at about 4.2% in FY2026 and 6.0% in FY2027 — a touch above the guidance midpoint, and a long way below the 19% of FY2025. Adjusted earnings per share are expected to fall about 18% in FY2026, to $1.33 from $1.63, before recovering 14% to $1.52 in FY2027, reflecting the guided margin step-down and the new interest load. The forward estimate revisions have been mixed rather than one-directional — three analysts raised and three cut their FY2026 numbers over the trailing month. The average analyst price target of $9.50 sits well above the roughly $6.07 share price, but the range is wide ($6.00 to $13.00) and the rating skew is neutral, with hold the most common call.
P/E (trailing, GAAP)
FCF Yield (trailing)
FCF Yield (FY2026 consensus)
Drawdown from 3-yr High
Source: derived from reported FY2025 financials and market data as of July 31, 2026; forward FCF yield on consensus estimates, as reported.
The pessimism is visible in the multiples: about 5.5 times trailing GAAP earnings, a 13.1% trailing free cash flow yield, and a consensus forward free cash flow yield near 19.5%. Those are the numbers a value buyer is drawn to. The counter-fact is on the same page: the yield is high partly because growth has decelerated to low single digits and reported earnings are guided down this year, and the cheap-looking equity now sits on top of $339 million of net debt rather than net cash. Gauging how much of that pessimism is warranted is the work of a dedicated valuation chapter; what this tab establishes is the arithmetic it starts from.
What would change this read
The financial record supports two things without much argument: TaskUs is a genuine, consistently profitable cash generator, and — even after the March 2026 dividend — its leverage is low enough that near-term bankruptcy risk is remote. It complicates a third: the balance-sheet cushion that made this look like a net-cash special situation is gone. The reads that would move are (1) the capex trajectory — if FY2026 capex lands near the guided $50 million and free cash flow rebounds above $100 million, the FY2025 cash dip confirms as a trough; if it does not, the conversion problem is structural; and (2) revenue growth — a return toward double digits would reframe the low multiple as a mispricing, while a slide back toward the FY2023 decline would validate it. Both are checkable each quarter in the cash flow statement and the revenue line.
Two limitations bound this tab. Per-service-line profitability is not disclosed, so the margin trajectory can only be read at the consolidated level. And the forward figures are consensus and management guidance, not results — the adjusted EBITDA margin outlook is offered without a GAAP reconciliation, which management attributes to the unpredictability of stock-based compensation and currency effects [28].
Cash Conversion
Over FY2022–FY2025 TaskUs turned each dollar of reported profit into about $2.40 of operating cash and $1.66 of free cash — cash has run ahead of earnings, the receivables are collectible, and no financing is dressed up as operating cash. Two cautions temper that: FY2025's 123% net-income jump overstates the operating gain (adjusted EBITDA margin was flat), and free cash flow — cut to 29.6% conversion by a receivable build and a capex peak — is the figure that actually underwrites the value case.
Operating Cash / Net Income, FY22–25 (x)
Free Cash / Net Income, FY22–25 (x)
FY2025 EBITDA-to-FCF Conversion
FY2025 FCF After Stock Comp ($M)
Sources: derived from FY2023–FY2025 cash-flow statements [1]; FY2025 Free Cash Flow reconciliation [2].
This chapter tests the "cash-generative" half of the report's central question, using the cash-flow statement rather than the income statement as the primary witness.
Cash has run ahead of profit
The most reassuring fact about TaskUs's accounting is the one a skeptic checks first: for four straight years operating cash flow held between $137 million and $147 million while reported net income sat far below it. From FY2022 through FY2025 the company earned $234 million of cumulative net income and generated $567 million of operating cash and $390 million of free cash — CFO of 2.4x earnings and FCF of 1.7x [3]. An earnings base that consistently understates cash is the opposite signature of an accrual-inflated one.
Source: FY2023–FY2025 Consolidated Statements of Cash Flows [4]; earlier years per company filings, as reported.
The mechanism behind the gap is visible in the cash-flow reconciliation. Net income carries roughly $61 million a year of non-cash depreciation and intangible amortization and another $30 million of stock-based compensation, and both are added back to reach operating cash [5]. The amortization is largely the writing-down of intangibles booked when Blackstone acquired the business in 2018 — a sunk accounting charge, not a recurring cash cost, so adding it back is legitimate. Stock compensation is different: it is a real cost to owners through dilution, so a conservative reader deducts it again further down.
Source: Consolidated Statements of Cash Flows, FY2023–FY2025 10-K [6]; FY2021 was an IPO stock-compensation loss year.
The one year that breaks the pattern is FY2025 itself, where CFO/NI fell to 1.3x and FCF/NI to 0.7x. That is not cash weakening — operating cash was flat — but net income catching up to cash. The rest of the chapter is about why that catch-up is softer than the headline, and why free cash flow slipped even as the business grew.
Behind the net-income jump
Reported net income rose 123% to $102.3 million in FY2025. The operating business did not improve by anything like that much. Adjusted EBITDA — the profit measure that strips out taxes, financing, depreciation, stock compensation, currency and one-offs — grew 18.7% to $249.1 million, and its margin was flat at 21.0% against 21.1% a year earlier [7]. The distance between an 18.7% operating gain and a 123% bottom-line gain is where the earnings-quality question lives.
Four items below the operating line did most of the work, and none reflects the delivery business getting more profitable per dollar of revenue:
A $15.4 million non-recurring litigation charge sat in the FY2024 base and did not recur in FY2025, flattering the comparison [8].
Stock-based compensation fell from $42.4 million to $30.4 million, an $11.0 million reduction in operating expense [9].
Foreign-exchange swung to an $8.0 million gain from a $1.3 million loss, and interest earned on the cash balance lifted other income [10].
The effective tax rate fell from 38.2% to 25.2%; holding the rate at the prior year's level would have cut roughly $18 million from net income [11].
The tax move is less dramatic than the headline rate suggests. Much of the GAAP rate volatility comes from non-deductible stock compensation and one-time costs measured against a small pretax base; on the company's own normalized basis the effective rate eased only from 26.4% to 23.9% [12]. Either way, the durable read on FY2025 profitability is the flat adjusted-EBITDA margin and the flat operating cash flow, not the doubled bottom line.
Source: Consolidated Statements of Operations and MD&A, FY2025 10-K [13]; net income margin derived from reported financials.
Net income margin nearly doubled from 4.6% to 8.6% while operating margin rose a more modest 9.3% to 11.9% — the bottom line grew faster than the operating line, which is the arithmetic tell that below-the-line items, not core delivery economics, drove the record year. The improvement is real; its slope is not repeatable at 123%.
Where the cash pressure shows: receivables and capex
Free cash flow fell to $73.7 million from $99.8 million even though operating cash was essentially flat, and the entire drop traces to two lines. The first is a $55.1 million increase in receivables that consumed operating cash [14]. Receivables grew 28% against 19% revenue growth, pushing days-sales-outstanding from about 68 in FY2022 to 78 in FY2025.
Source: derived from receivables and revenue, FY2022–FY2025 balance sheets and income statements [15].
More than half of that receivable build is unbilled revenue — work performed and recognized over time but not yet invoiced — which rose from $92.7 million to $122.4 million and now accounts for roughly 48% of total receivables [16]. That growth is consistent with the shift toward over-time and outcome-based contracts — the "single price per solution" pricing described in the automation chapter (Automation Offset) — where TaskUs delivers before it bills. It is a working-capital timing cost, not fictitious revenue: the allowance for doubtful accounts is tiny and shrinking, at $0.9 million against $254 million of receivables, with full-year write-offs of $1.4 million [17]. The receivables are collectible; they are simply arriving as cash more slowly.
The second line is capital expenditure, which jumped to $63.5 million (5.4% of revenue) from $39.1 million, driven by facility build-outs to house the year's headcount growth [18]. Together the receivable build and the capex peak cut the conversion of adjusted EBITDA into free cash flow to 29.6% from 47.5% [19].
Source: Consolidated Statements of Cash Flows, FY2023–FY2025 10-K [20]; 2026E is the company's guided figure [21].
Whether FY2025's capex was a peak or a new floor is the single number this chapter is most sensitive to, and the filings do not split maintenance from growth spend. Management guides capex down to about $50 million in FY2026, which would place it near 4% of revenue — back toward the FY2022–FY2024 band [22].
Collectible receivables, no factoring
Beyond the receivables and capex, the cash-flow statement is unembellished in ways worth naming. TaskUs's credit agreement expressly permits a receivables factoring or securitization facility [23], which would let the company pull cash forward by selling those growing receivables — and it has never drawn one. The receivable movement flows entirely through operating working capital, with no receivable-sale proceeds routed into operating cash [24]. Cash taxes paid of $35.7 million tracked the $34.4 million book tax provision, so the tax line is not inflating operating cash through deferral either [25]. For a reader whose stated priority is a near-zero chance of nasty surprises, the plumbing behind the cash number is clean.
The receivable build that dragged free cash flow sits against a $0.9 million doubtful-account allowance on $254 million of receivables — a timing cost, not a credit problem.
Three free-cash-flow numbers
Because the value case rests on a free-cash-flow yield, it matters which free-cash-flow figure is used. There are three defensible ones, and they are far apart. The company reports free cash flow of $73.7 million (operating cash minus capex). Management's "adjusted free cash flow" of $89.9 million adds back roughly $16 million of non-recurring cash costs — take-private and litigation payments — and is the basis for its forward guide [26]. The most conservative figure deducts stock compensation as the real dilution cost it is, leaving owner free cash flow of about $44 million.
Source: FY2025 Free Cash Flow reconciliation [27]; adjusted figure per Q4 FY2025 call [28]; yields on the $565M market capitalization at 31 July 2026.
On the $565 million equity value, that is an owner-FCF yield of 7.8%, a reported-FCF yield of 13.1%, and an adjusted-FCF yield of 15.9%. The high-teens yield that makes the stock look like a bargain in the margin-of-safety work (Margin of Safety) uses the most generous of the three; the number a conservative owner underwrites is closer to 8%. Both are respectable for a business still growing; the point is that the honest range is wide, and it narrows only if conversion recovers.
The FY2026 test
The chapter's central uncertainty — whether the low conversion is a capex-peak trough or a structural reset — has an early read in the first quarter of FY2026, and it leans toward trough. Capex fell to $10.2 million from $14.5 million a year earlier, and management cut the full-year capex guide by $10 million to about $50 million [29]. Operating cash rose to $46.3 million from $36.3 million on stronger collections — the receivables timing beginning to reverse — and the company raised its full-year adjusted free-cash-flow guide to $110 million at the midpoint, up from $73.7 million reported in FY2025 [30].
The read on earnings quality, offered once: TaskUs's reported profit is backed by real, collectible cash, and the accounting is clean — the core worry for a bankruptcy-averse value reader is answered in the affirmative. The caution is directional rather than a matter of integrity. FY2025's headline growth flatters the trend, and the free cash flow that underwrites the value case is $73.7 million reported, or nearer $44 million after stock compensation — not the $110 million forward figure. What would confirm the recovery: FY2026 capex landing near the guided $50 million with days-sales-outstanding flattening. What would break it: capex staying above roughly $55 million, or receivables continuing to outgrow revenue, which would mark 29.6% conversion as the new normal rather than a trough.
Watch items: full-year capex versus the guided $50 million; days-sales-outstanding versus FY2025's 78 days; and adjusted-EBITDA-to-free-cash-flow conversion versus the 47.5% run-rate it fell from.
Automation Offset
TaskUs's 11.9% operating margin is a real cash-arbitrage spread (SBC just 2.5% of revenue), but the arbitrage work is being automated at its largest client Meta (26% of revenue) and in its most-exposed line Trust & Safety (26%, guided to decline in 2026), while the onshore, lower-margin AI Services line that is replacing it helps cut guided FY2026 adjusted EBITDA margin to ~19% from 21.1%. [1] [2] [3]
The stakes are asymmetric and near-term. Trust and Safety is 26% of revenue — $307.4 million — guided to decline in 2026, while AI Services, at 18% of revenue and $214.2 million, must more than double, toward triple, to hold the top line [4] [5]. If that offset stalls, the roughly 3.5% guided revenue growth turns negative and the ~200-basis-point cut to adjusted EBITDA margin deepens [6]. The counter-fact sits in the same frame: in Q1 FY2026 TaskUs delivered a 19.1% adjusted EBITDA margin, above the ~19% full-year guide [7].
TaskUs's largest client, Meta, is 26% of revenue and has begun automating the Trust and Safety work TaskUs performs for it — using, in part, models TaskUs itself helped build [8] [9]. Trust and Safety, also 26% of revenue, is guided to decline in 2026 [10] [11]. The offset is AI Services, up 59% to $214 million and led by autonomous-vehicle, robotics, and foundational-model work [12]. Whether that offset holds, and at what margin, is what the 2026 guide of 3.5% growth quietly tests.
The Industry tab established generative-AI automation as a structural force acting on the whole BPO field, and Competition tested TaskUs's replaceability claim against its rivals. This chapter takes the question inside the company: how much of TaskUs's own revenue is exposed to automation now, what is replacing it, and whether the replacement carries the same economics as the work it displaces.
Automation has reached the largest account
For most of the outsourcing industry the automation threat is a forecast. For TaskUs it is a booked event, concentrated in its two most important places: its largest client and its Trust and Safety line — which happen to be the same 26% twice over.
Meta is named in the FY2025 10-K as the largest client at 26% of revenue, up from 22% in 2024 and 19% in 2023; the top ten clients are 58% of revenue and the top twenty are 71% [13] [14]. Rising client concentration is usually read as a sign of a deepening relationship. Here it coincides with that same client's decision to automate.
Source: FY2025 Annual Report (Form 10-K), revenue concentration by customer [15].
Management has been explicit about what comes next. On the Q4 2025 call the CEO said the largest client "signaled they intend to leverage AI to drive efficiencies across their organization in 2026," and that TaskUs expects "this effort will impact some of the work that we do for them" — the primary reason full-year 2026 revenue is guided to just 3.5% growth after 19% in 2025 [16]. The FY2025 10-K makes the same admission in risk-factor language: certain clients, "including our largest client, have announced automation initiatives," which "may lead to revenue growth in the near term but may ultimately result in the automation of some services that TaskUs currently provides for these clients" [17].
The exposure runs along service lines, not just accounts. Trust and Safety — content moderation and policy enforcement, mostly for social-media platforms — grew 23.9% to $307.4 million in 2025 and is 26% of revenue [18]. On the Q1 2026 call the CEO said the company now expects "Trust and Safety revenues to decline for the full year," with the decline "primarily driven by our largest client" but visible "across other social media customers" too, and concluded plainly: "automation is most materially impacting our Trust and Safety business" [19].
The most self-revealing detail is who built the automation. Describing the shift of some Trust and Safety revenue into AI Services, management explained it as "the work that we've done to build the models that have automated Trust and Safety workflows" — TaskUs helped train the models now displacing its own moderators, and keeps a smaller maintenance revenue stream for evaluating and updating them [20]. That is the labor-arbitrage engine automating at the seam the report's through-line points to.
The offset is real, fast, and differently shaped
AI Services is the answer to the drag, and on its own terms it is working. The line reached $214.2 million in 2025, up 58.6%, and management notes it has grown more than 30% year-over-year for six consecutive quarters and made up roughly 40% of Q4 signings [21] [22]. The rotation is visible across the whole five-year record: AI Services actually shrank in 2023 (down 8.9%) and was flat in 2024 before the 2025 surge, so the offset is recent, not a long-established second engine.
Sources: FY2025 Annual Report (Form 10-K), service revenue by offering, for 2024–2025 [23]; FY2023 Annual Report (Form 10-K) for 2021–2023 [24].
Source: FY2025 Annual Report (Form 10-K), MD&A — Service revenue by offering [25].
But the replacement revenue is shaped differently from the seat-based work it succeeds, in three ways that matter for a cash-focused reader.
First, its composition is shifting away from the platforms that pay TaskUs today. Growth from here is led by autonomous-vehicle, robotics, and foundational-model clients — a cohort management guided to "more than double" in 2026 on the Q4 call and pointed toward tripling by the Q1 call [26] [27]. These are well-funded but early-stage buyers whose spend is tied to model-training cycles rather than steady support volumes, and their identities are undisclosed — so the durability that made the old book predictable cannot yet be assumed for the new one.
Second, it is being delivered at lower margin. Management attributed part of the 2026 margin step-down to "geo mix shift as recently signed AI Services contracts ramp in onshore locations where we typically realize lower margins," with only a hope of moving some of that work offshore "in the years to come" [28] [29]. The offshore Philippines base that underwrites the labor-arbitrage spread (Business) is precisely what the fastest-growing new work does not use.
Third, per-line profitability is undisclosed. TaskUs reports revenue by service line but not margin by service line, so whether AI Services earns more or less per dollar than the Trust and Safety work it replaces cannot be verified from the filings — it can only be inferred from the consolidated margin, which is guided down. That gap is the single largest limitation on underwriting the offset, and it is the same one flagged in Business and Financials and Estimates.
The pricing model transfers the risk to TaskUs
The second part of the offset is a change in how TaskUs charges. In Digital CX it is moving from time-based billing toward a "single price per contact," under which it guarantees a 100% resolution rate and "meaningful per contact savings from day one" in exchange for the right to deploy AI agents; it then must "earn back the cost savings and additional margin by increasing the effectiveness of AI agents" [30]. In its AI-consulting engagements it is, for now, "acting as a reseller" for partners Decagon and Regal, "marking up the preferential pricing" it receives, while investing heavily upfront with the longer-term goal of an outcome-based "single price per solution" [31].
This is a deliberate transfer of risk onto TaskUs's own income statement. Under a per-seat contract the client bears the productivity risk; under a guaranteed-outcome contract TaskUs does. Management frames it as putting the company "in control of our margin profile," which is true in both directions: it captures the efficiency upside, but it also absorbs the shortfall if AI agents underperform the guarantee [32]. The near-term cost is already in the guide — full-year 2026 adjusted EBITDA margin of roughly 19%, down from 21.1% in 2025, which management attributes to AI-transformation investment plus the onshore mix [33].
The company's own language on the technology has moved in step with the exposure. The FY2023 10-K described the future of generative AI as "one of augmentation rather than automation" [34]. The FY2025 10-K keeps the standing risk that "more tasks currently performed by our team members may be replaced by automation, robotics, AI, chatbots and other technological advances, which puts our lower-skill tier one customer care offerings at risk," and pairs it with the concrete acknowledgment that the largest client's automation may remove work TaskUs currently does [35] [36]. The reassuring frame of two years ago and the booked headwind of today are describing the same trend at different distances.
The commercial signals decayed once already
TaskUs discloses three operating metrics that bear on demand: net revenue retention, win rate, and new-client wins. They recovered through 2024–2025, but the history shows how quickly they can turn, and management itself cautions they "should not be viewed as leading indicators of our revenue" [37].
Sources: TaskUs annual reports, FY2019–FY2025 — net revenue retention and win rate as reported; anchor figures from the FY2025 10-K [38], FY2023 10-K [39], and FY2021 10-K [40].
Net revenue retention — the growth of existing clients — ran at 141% in 2021, collapsed to 89% in 2023 as the demand cycle turned, and has climbed back to 113% in 2025, still well below the pre-2022 peak [41] [42] [43]. Win rate — the share of pursued dollars won — has oscillated between 35% and 49% with no clear trend, landing at 36% in 2025 on 34 new clients, the fewest in five years [44] [45]. The cross-sell metric points the other way: clients using more than one service line rose 14% to 73, evidence the multi-line land-and-expand motion still functions even as any single line is automated [46].
The 2023 episode is the useful precedent. It shows the business can lose roughly a fifth of its existing-client revenue base in a single downcycle and recover — but recovery took two years and came from a different mix. The automation drag now beginning in Trust and Safety is a structural reduction in a specific kind of work, not a cyclical dip in all of it, so the 2023 rebound is a reason for measured confidence, not a template.
The offset against the drag
The 2026 guide is the first clean read on the arithmetic, because it nets the automation drag against the AI-Services offset inside a single number. Management's building blocks: Trust and Safety declining year-over-year; the largest client's work impacted by its own AI efficiency drive; against that, the top twenty clients excluding the largest guided to grow about 15%, and the autonomous-vehicle, robotics, and foundational-model cohort guided to more than double [47] [48]. The sum of those forces is roughly 3.5% revenue growth at guidance midpoint.
Source: Q4 FY2025 and Q1 FY2026 earnings call transcripts [49] [50].
Read against the through-line, the 2026 guide is the offset only just clearing the drag. Automation at the largest client and across Trust and Safety is large enough to cut revenue growth from 19% to about 3.5% and to compress adjusted EBITDA margin by roughly 200 basis points, but AI Services plus ex-largest-client growth is — on management's numbers — still enough to keep the top line positive. On the evidence to date, the automation of TaskUs's arbitrage work is being replaced faster than it is being lost, but the replacement is lower-margin, earlier-stage, and more concentrated in undisclosed clients than the book it succeeds.
The strongest fact against a darker read is that AI Services is winning the same work as data-labeling specialists that have scaled into the hundreds of millions to a billion-plus in revenue, and management believes it can more than double the line — so the offset has room to run well beyond 2026 if that demand holds [51]. The strongest fact against a benign read is that the offset's growth is powered by model-training demand that is inherently lumpy and by clients TaskUs does not name, while the eroding base — Meta and Trust and Safety — is 26% of revenue and known to be shrinking.
What would change the read is observable within a year: whether Trust and Safety's decline stays contained to the guided path or accelerates to other platforms; whether the AV, robotics, and foundational-model cohort delivers the guided doubling or proves as cyclical as AI Services looked in 2023; and whether adjusted EBITDA margin stabilizes near 19% once the onshore ramp matures or keeps drifting as guaranteed-outcome pricing takes hold. Those three data points, not the headline multiple, are what tell a reader whether the offset is a bridge to a durable AI-era business or a slower way down.
Controller Alignment
TaskUs is run by the people who own it: Blackstone and the two co-founders hold about 82% of the economics and 96.9% of the votes [1]. In February 2026 that control expressed itself directly in the balance sheet. TaskUs borrowed $500M to pay a $332.8M special dividend — about 4.5x its $73.7M FY2025 free cash flow — turning $29.7M of net cash into ~$339M of net debt, with roughly $270M (~82%) of the payout flowing pro-rata to Blackstone and the co-founders. [2] [3]
The stakes sit on the cushion that borrowing spent. It converted a $29.7M net-cash balance sheet — about 0.12x adjusted EBITDA — into ~$339M of net debt near 1.4x, and added roughly $31M a year of interest against flat ~$137M of operating cash flow (Cash Conversion); the near-net-cash floor that anchored the special-situation, near-zero-bankruptcy case for this name is gone. The counter sits in the same breath: the leverage is serviceable, management frames the post-refinancing profile at about 1.5 times adjusted EBITDA and calls it a "disciplined leverage profile" [4], and the dividend was strictly pro-rata — every holder, inside and out, received the identical $3.65 a share. It was the controllers' second act toward the minority in four months: the previous October they had been vetoed 12-to-1 trying to take the whole company private at $16.50. Read together, the two events say the same thing — interests align on returning cash, and diverge on price.
Who owns the economics
Control group — economics
Control group — votes
Rejected take-private bid
Special dividend / share
Dividend to controllers ($M)
Source: economic and voting split derived from the beneficial-ownership table in the TaskUs merger proxy (shares as of 4 August 2025) [5]; combined voting power per the 2026 proxy [6]; dividend per share and controller receipts from the arithmetic below.
The ownership map is the starting point, and the fixed People tab draws it in full; the piece that matters here is the gap between economics and votes. TaskUs has a dual-class structure — Class A carries one vote, Class B ten [7] — so the control group's 82% of the shares translates into 96.9% of the votes. The minority owns roughly 18% of the company and, on a normal reading, almost none of the say.
Source: share counts and voting power from the merger-proxy beneficial-ownership table (as of 4 August 2025) [8]; dividend receipts = shares × $3.65, author's calculation. Co-founder totals combine Class A and Class B holdings; percentages are of 89,875,981 shares outstanding.
The two co-founders are not passive holders. Bryce Maddock is chief executive and Jaspar Weir a co-founder-director, and between them they own about 29% of the company — the founder skin-in-the-game the record actually shows. Blackstone, the 2018 sponsor, holds the largest single block at about 52% of the shares and 65% of the votes on its own. That last figure carries more weight than it first appears, and the take-private is where it showed.
What the controllers would pay
In March 2025 the controllers moved to take TaskUs private. Because the buyers were the company's own control group, the board handed the decision to a special committee of independent directors, which ran the negotiation over roughly two months and twelve formal meetings with its own advisers [9]. The committee extracted two price bumps, taking the offer from an opening $16.00 to a final $16.50 a share, and the term that ultimately settled the outcome: a majority-of-the-minority vote, under which the deal could close only if a majority of the shares not held by the buyers approved it [10].
Source: negotiation history disclosed in the TaskUs proxy supplement [11], corroborated by the background-of-the-merger narrative in the definitive proxy [12].
The $16.50 offer was struck at 7.0 times 2025-estimated adjusted EBITDA [13] — inside the 6.8x–7.6x band that independent precedent BPO deals had cleared, and comfortably above where the stock traded (Margin of Safety). The controllers, in other words, offered the minority a genuine control premium. The minority said no.
The vote on 8 October 2025 is worth reading in full, because it shows the majority-of-the-minority working exactly as designed. The merger needed four separate approvals. Three of them — a majority of combined votes, of the Class A class, and of the Class B class — passed easily, carried by the controllers' own shares [14]. The fourth — a majority of votes cast by the public stockholders — failed, and failed lopsidedly: 840,473 shares for against 10,064,296 shares against, roughly 92% of the unaffiliated votes cast in opposition [15].
Source: final voting results and the four approval thresholds, TaskUs Form 8-K reporting the special-meeting outcome [16]; threshold definitions on the preceding page [17].
The agreement was mutually terminated the next day, with no termination fee owed by either side [18]. The controllers did not come back with a higher number. What that reveals is the more useful fact: $16.50 was at or near the top of what the buyers were willing to pay, and rather than raise it they walked away.
Reading the alignment
The two events point in the same direction on the question this reader cares about most: are the owner-operators aligned with the minority, or extracting from it? The honest answer is aligned on cash, unresolved on price.
The alignment is real and it is unusually clean. The co-founders are operators with about 29% of the company at stake, so a dollar of value they destroy is a dollar out of their own pockets; the largest capital actions of the past two years — a $200M buyback authorization, then a pro-rata dividend (Financials and Estimates) — returned cash to all holders equally rather than to insiders alone; and the related-party ledger is small. In FY2025 the company recognized $12.7M of revenue from Blackstone-affiliated entities and paid $0.6M to them, plus a $1.0M fee to a Blackstone broker-dealer for placing the 2026 refinancing [19]. Those are footnote-sized figures against $1.18B of revenue — Blackstone is a controller and an occasional counterparty, but not, on this evidence, a siphon.
The tension sits on the exit. The controllers have revealed, through the rejected bid they declined to raise, that they value the company at no more than about $16.50 a share — and the minority, through a 92%-against vote, told them that was too low. Both sides cannot be right, and the minority's veto, however emphatic, does not come with a mechanism to force a better price. The majority-of-the-minority protection is a shield, not a sword: it let 18% of the economics block a sale they judged cheap, but it cannot make the 82% pay more. A minority holder here is aligned with the controllers on getting cash out of a cash-generative business, and adverse to them on what the business is ultimately worth in a change of control.
The dual-class clock is not a trigger
One reading floated earlier in this report deserves a correction. TaskUs's Class B super-voting shares carry a sunset — the earlier of 10 June 2028 or a holder's stake falling below set thresholds — that People documents in full [20]. It is tempting to read that 2028 date as a deadline forcing the controllers to re-bid while they still hold the ten-to-one lever. The ownership math says otherwise: Blackstone alone holds about 52% of the shares outstanding, and the control group about 82%, so even after the super-vote lapses and every share counts equally the controllers keep an outright majority of the votes. The sunset removes a supermajority they do not need for control; it does not hand the minority leverage, and it does not put a clock on a second offer. A re-bid, if one comes, will come because the controllers want the asset at a price the minority will clear, not because a governance deadline compels it.
What would change the read
The alignment verdict is provisional, and a handful of observable events would move it. A fresh take-private bid meaningfully above the rejected $16.50 would confirm the controllers see value the tape does not and would reset their revealed reservation price; a bid at or below $16.50 would confirm the ceiling this chapter infers. A second debt-funded dividend, or leverage pushed materially past the ~1.5x the company calls disciplined, would tilt the read from "returning cash" toward "extracting it," especially if free-cash-flow conversion stays under pressure (Cash Conversion). And a step-up in related-party revenue or fees beyond today's footnote scale would erode the clean counterparty record. Absent those, the base case holds: a founder-controlled, cash-generative business whose owners return capital to everyone on equal terms, whose minority holds a real veto over a sale but no lever over its price, and whose control is durable enough that no calendar forces the next move.
Margin of Safety
TaskUs at $6.07 trades at the midpoint of Evercore's conservative Case-B DCF ($5.10-$7.50) and about 37% of the $16.50 its own controllers offered to go private — a bid they revealed as a ceiling by walking with no fee rather than raising after a 92%-against minority veto.[1][2][3]
That single price does two jobs at once, and both are quantifiable. Sitting at the Case-B midpoint of about $6.30, the margin of safety is thin against Case B and wide against anything better: a move back toward Evercore's base "Case A" DCF of $12.40 to $20.20 a share (midpoint ~$16.30) [4] is roughly a double, contingent on the automation drag proving cyclical and adjusted free cash flow rebuilding to the guided $105–$115M [5]. The counter-fact belongs in the same breath: the rejected $16.50 is a ceiling for buyers, not a floor under the stock — it was struck on the pre-automation Case-A trajectory, and the same controllers walked rather than raise it. The margin of safety is real against the pre-automation forecasts, and roughly absent against the one that now describes the guide.
What the price buys
Share Price
Enterprise Value ($M)
EV / FY2025 Adj. EBITDA
Trailing FCF Yield
Drawdown from 3-yr High
Source: share price and market data as of 31 July 2026, as reported; enterprise value derived from Q1 FY2026 total indebtedness of $491.6M [6] less cash of $152.3M [7], plus market capitalization; FY2025 adjusted EBITDA of $249.1M [8].
The equity is priced at roughly $565M against a business that earned $102.3M of net income and $249.1M of adjusted EBITDA in FY2025 [9] — about 5.5 times trailing earnings and a 13.1% trailing free-cash-flow yield. That is the surface a value screen returns: a former growth name down 68% from its three-year high, against a peer-group median drawdown of 46.7%. The screen is the reason to look; it is not the analysis.
The analysis begins one line lower on the balance sheet. In March 2026 the company borrowed to pay a $332.8M special dividend (Financials and Estimates), so the equity no longer sits on net cash. Enterprise value is now about $900M — market capitalization plus roughly $339M of net debt [10] — and the whole business changes hands at about 3.6 times FY2025 adjusted EBITDA. A cheap-looking equity multiple and a less-cheap enterprise multiple describe the same company; which one a buyer should weigh depends on whether the buyer inherits the debt, and here the buyer does.
Three anchors above the price, one below
The most useful valuation work on TaskUs was not done by the sell side. It was done by Evercore, the financial adviser to the special committee that evaluated the 2025 attempt to take the company private at $16.50 a share [11]. Its fairness analyses, disclosed in the merger proxy, are the closest thing the record holds to a full intrinsic-value study, and they bracket the stock from both sides.
Sources: Evercore financial analyses and comparable ranges, TaskUs merger proxy — public comparables [12], implied per-share ranges [13], DCF Case A [14], DCF Case B, premia and analyst targets [15]; merger price [16]; current mean target, consensus estimates as reported.
Four of the five backward-looking anchors sit well above $6.07. Evercore's discounted cash flow on management's base "Case A" forecasts produced $12.40 to $20.20 a share, using a 10.5%–12.5% discount rate and a 3.0%–5.0% perpetuity growth rate [17]. Its public-comparables work — a customer-experience peer set trading at about 5 times forward adjusted EBITDA — implied $12.20 to $15.60 across its two forecast-year bases [18]. Precedent BPO deals cleared at 6.8 to 7.6 times last-twelve-months adjusted EBITDA [19]. On any of these frames the current price is less than half of intrinsic value.
The fifth anchor is the one that matters. Evercore also ran the DCF on a conservative "Case B" forecast, and that produced an implied value of $5.10 to $7.50 a share [20]. Today's $6.07 falls almost exactly at its midpoint. The market is not pricing TaskUs at a discount to fair value; it is pricing TaskUs at the bank's own downside case, computed before the downside began to show in the numbers.
Why Case B is the live case
The Evercore ranges carry a date stamp that decides how to read them. They were struck in May 2025, against a $14.38 close [21], and Case A embedded the growth trajectory the company was still guiding to at the time. What has happened since is the automation cross-current (Automation Offset): management now guides FY2026 revenue to $1,210–$1,240M, up roughly 3.5% at the midpoint from 19.0% in FY2025, with adjusted EBITDA margin easing to about 19% [22], and its Trust and Safety line guided to decline [23]. A low-single-digit grower with a compressing margin is the Case B animal, not the Case A one. The stock has re-rated to the conservative forecast because the conservative forecast is now the base forecast.
That reframes the multiple comparison rather than erasing it. At about 3.6 times FY2025 adjusted EBITDA — closer to 4 times on the stricter, stock-comp-excluded basis Evercore used [24] — TaskUs still trades below the 5.0x–6.0x range Evercore applied to its customer-experience peers and well below the 6.8x–7.6x precedent-deal band. But those benchmarks are also May 2025 marks, and the peer set has de-rated with it: the comparison shows TaskUs is cheap relative to where CX outsourcers traded a year ago, not that it is cheap on a multiple the market is willing to pay today.
Sources: TaskUs current enterprise value derived from Q1 FY2026 filings [25] and FY2025 adjusted EBITDA [26]; peer and precedent multiples per Evercore analyses, May 2025 [27], [28].
What insiders said value was, in cash
The take-private attempt is a second, independent read on value — this one revealed by action rather than by model. Blackstone and the two founders, who together control the vote, offered $16.50 a share to buy out the minority [29]. The minority declined it: at the October 2025 special meeting the requisite stockholders did not approve the merger, and the deal was terminated with no fee paid [30]. Both sides of the control table put fair value above $16.50 — the controllers by bidding it, the minority by refusing it as too low.
That $16.50 is now $10.43 of air above the traded price, and it is tempting to read the gap as embedded upside. It should be read with care, in three parts. First, the bid was struck at a $14.38 share price on a Case-A trajectory; the same automation deceleration that pulled the stock to $6 would pull a re-bid well below $16.50. Second, the controllers did not raise their offer when the minority balked — they walked, then four months later paid themselves a $332.8M debt-funded special dividend [31], a route that returns cash pro-rata without paying minority holders a control premium. Third, the same insiders retain the votes to try again on their own timetable. The revealed-preference signal is genuine and it favors the long case; it is not a floor.
What has to be true
For the value reader, TaskUs resolves into a single, testable fork, and both prongs are visible in the cash flows rather than in the story.
The stock is priced at the conservative Case-B DCF ($5.10–$7.50). It is cheap only if the business tracks nearer to Case A than to Case B — that is, if the automation drag proves cyclical and free cash flow rebuilds — and roughly fairly valued if Case B is the destination.
The evidence that the drag is cyclical is the forward cash guide: management expects adjusted free cash flow of $105–$115M in FY2026, up from $73.7M, as the FY2025 capital-spending peak rolls off [32]. On the current price that is a high-teens forward free-cash-flow yield, and even the reduced 2026 consensus price target of $9.50 sits well above the tape. The evidence on the other side is that the guided margin steps down and the most automation-exposed revenue is guided to shrink — so the free-cash-flow rebuild depends on lower-margin AI Services work replacing higher-margin arbitrage volume faster than the volume erodes (Automation Offset).
Two facts bound the downside. The balance sheet, though no longer net cash, carries no maturities until the 2031 term loan and services roughly $31M of annual interest out of well over $100M of operating cash flow [33] — the chance of forced distress is low, which matters for a reader who wants bankruptcy risk near zero. And the price already embeds a conservative forecast, so the asymmetry is not symmetric: the margin of safety is thin against Case B and wide against anything better. What would settle the read is not a valuation debate but two or three quarters of data — whether adjusted free cash flow lands in the guided $105–$115M band and whether Trust and Safety stabilizes or keeps sliding.
The numbers behind TaskUs, Inc.: as-reported financial statements and company metrics for FY2021–FY2025, traced to the source filings, opened with the share-price history those statements have to justify. Every linked figure opens the exact page of the filing it was printed on, with the statement row highlighted. Amounts in US$ thousands unless noted.
Reading notes: Display units are US$ thousands, exactly as printed in the filings ("in thousands, except share and per share data"). Each fiscal year's figures are cited to that year's own Form 10-K: FY2025 pp.95/97/100/111, FY2024 pp.95/97/100/112, FY2023 pp.73/74/77/87, FY2022 pp.73/75/78/88, FY2021 pp.138/140/144/157. The income statement is titled 'Consolidated Statements of Income' in the FY2024 and FY2025 10-Ks and 'Consolidated Statements of Operations' in the FY2021–FY2023 10-Ks. Revenue by service offering: the FY2021 10-K labeled the second and third lines 'Content Security' and 'AI Operations'; these were renamed 'Trust Safety' (also printed 'Trust + Safety' in FY2024) and 'AI Services' in later filings. Values are continuous across the rename.
Share Price — Full Available History — 5 Years
The stock closed at $6.07 on Jul 31, 2026 — down 80% over the window shown (-27.2% a year), trading between $4.57 and $83.51. At that close the stock trades at 5.5× FY2025 diluted EPS as reported below.
Source: market price feed, weekly closes, sampled from 1,291 source observations, Jun 2021–Jul 2026. Price return only, excludes dividends.
Market capitalization $565mn and enterprise value $594mn.
Market cap = 93.0M shares outstanding × the Jul 31, 2026 close of $6.07. Enterprise value adds total debt of $241mn and subtracts cash and equivalents of $212mn (net debt of $30mn), from the FY2025 balance sheet. Market-derived figures, shown without filing links.
FY2025 at a Glance
Revenue (US$ thousands)
Operating income (US$ thousands)
Net income (US$ thousands)
Diluted EPS
Source: FY2025 consolidated statements [1] [2] [3] [4]. Click any linked figure to open the filing page with the row highlighted.
Service Revenue by Offering
| Service Revenue by Offering | FY2021 | FY2022 | FY2023 | FY2024 | FY2025 |
|---|---|---|---|---|---|
| Digital Customer Experience | 486,679 | 637,587 | 605,943 | 611,837 | 661,899 |
| Trust and Safety | 169,080 | 178,409 | 186,742 | 248,041 | 307,430 |
| AI Services | 104,944 | 144,493 | 131,680 | 135,107 | 214,218 |
| Service revenue | 760,703 | 960,489 | 924,365 | 994,985 | 1,183,547 |
| Service revenue growth, derived | — | +26.3% | -3.8% | +7.6% | +19.0% |
Source: Disaggregation of Revenue footnote (revenue by service offering); Trust & Safety was labeled "Content Security" and AI Services "AI Operations" in the FY2021 Form 10-K. [5] [6] [7] [8]. Click any linked figure to open the filing page with the row highlighted.
Income Statement
Source: Consolidated Statements of Income (FY2024-FY2025) / Consolidated Statements of Operations (FY2021-FY2023) [1] [2] [3] [4]. Click any linked figure to open the filing page with the row highlighted.
Columns marked E are consensus analyst estimates from S&P Capital IQ (CapIQ), shown alongside reported results for direct comparison; they are not company guidance.
Estimate source: S&P Capital IQ (CapIQ) consensus, as of 2026-08-03. Estimate figures are S&P Capital IQ consensus (vendor data — no filing page links). EPS and net income use the normalized (adjusted) consensus where the street reports it. Line-item analyst models (segments, drivers, KPIs) are in the Visible Alpha tab.
Balance Sheet
Source: Consolidated Balance Sheets [9] [10] [11] [12]. Click any linked figure to open the filing page with the row highlighted.
Cash Flow
Source: Consolidated Statements of Cash Flows [13] [14] [15] [16]. Click any linked figure to open the filing page with the row highlighted.
Client Base Revenue Concentration
| Client Base Revenue Concentration | FY2021 | FY2022 | FY2023 | FY2024 | FY2025 |
|---|---|---|---|---|---|
| Largest client, Meta (% of revenue) | 27.0% | 22.0% | 19.0% | 22.0% | 26.0% |
| Top 10 clients (% of revenue) | 62.0% | 58.0% | 55.0% | 56.0% | 58.0% |
| Top 20 clients (% of revenue) | 76.0% | 72.0% | 68.0% | 68.0% | 71.0% |
| Clients generating over $1.0M revenue | — | — | — | 102 | 98 |
Source: company filings [17] [18] [19] [20]. Click any linked figure to open the filing page with the row highlighted.
Client Acquisition Cross-Sell
| Client Acquisition Cross-Sell | FY2021 | FY2022 | FY2023 | FY2024 | FY2025 |
|---|---|---|---|---|---|
| New clients won | 41 | 40 | 47 | 39 | 34 |
| New client win rate | 49.0% | 43.0% | 35.0% | 45.0% | 36.0% |
| Current clients signing new statements of work | 69 | 63 | 58 | 63 | 67 |
| Clients using multiple service lines | — | — | — | 64 | 73 |
Source: company filings [17] [21] [18] [22]. Click any linked figure to open the filing page with the row highlighted.
Global Delivery Footprint
| Global Delivery Footprint | FY2021 | FY2022 | FY2023 | FY2024 | FY2025 |
|---|---|---|---|---|---|
| Philippines headcount | 27,100 | 31,800 | 30,400 | 35,500 | 38,100 |
| Philippines share of headcount | 68.0% | 64.0% | 63.0% | 60.0% | 58.0% |
| Delivery sites | 23 | 27 | 28 | 28 | 31 |
| Countries of operation | 10 | 13 | 12 | 12 | 13 |
| Revenue delivered via non-voice / digital channels | 95.0% | 92.0% | 88.0% | 87.0% | 87.0% |
Source: company filings [23] [24] [25] [26]. Click any linked figure to open the filing page with the row highlighted.
Non-GAAP Profitability Cash Generation
| Non-GAAP Profitability Cash Generation | FY2021 | FY2022 | FY2023 | FY2024 | FY2025 |
|---|---|---|---|---|---|
| Adjusted EBITDA | 187,910 | 223,204 | 220,797 | 209,867 | 249,074 |
| Adjusted EBITDA margin | 24.7% | 23.2% | 23.9% | 21.1% | 21.0% |
| Adjusted Net Income | 129,389 | 142,815 | 126,542 | 118,684 | 151,709 |
| Adjusted EPS (diluted) | 1.26 | 1.39 | 1.32 | 1.29 | 1.63 |
| Free Cash Flow | (92,037) | 103,337 | 112,675 | 99,784 | 73,715 |
| Adjusted EBITDA-to-Free-Cash-Flow conversion | (49.0%) | 46.3% | 51.0% | 47.5% | 29.6% |
Source: company filings [27] [28] [29] [30]. Click any linked figure to open the filing page with the row highlighted.
Long-Term Record
| Fiscal year | Total revenue | Operating income (loss) | Net income (loss) | Diluted earnings (loss) per share | Operating cash flow |
|---|---|---|---|---|---|
| FY2019 | 359,681 | 36,862 | 33,940 | 0.37 | 43,789 |
| FY2020 | 478,046 | 50,329 | 34,533 | 0.38 | 58,873 |
| FY2021 | 760,703 | (54,282) | (58,698) | (0.62) | (32,674) |
| FY2022 | 960,489 | 83,897 | 40,422 | 0.39 | 147,095 |
| FY2023 | 924,365 | 95,038 | 45,690 | 0.48 | 143,670 |
| FY2024 | 994,985 | 92,424 | 45,870 | 0.50 | 138,888 |
| FY2025 | 1,183,547 | 140,626 | 102,275 | 1.10 | 137,215 |
Source: consolidated statements across filings; older years from the standardized feed [13] [1] [31] [32]. Click any linked figure to open the filing page with the row highlighted.
Operating KPIs
| KPI | FY2021 | FY2022 | FY2023 | FY2024 | FY2025 |
|---|---|---|---|---|---|
| Worldwide headcount | 40,100 | 49,500 | 48,200 | 59,000 | 65,500 |
Source: company-reported operating metrics [33] [34] [35] [36]. Click any linked figure to open the filing page with the row highlighted.
Analyst Consensus
Mean target
Median target
High target
Low target
Street ratings: 2 strong buy, 5 hold, 1 strong sell. Consensus: Hold.
Estimate source: S&P Capital IQ (CapIQ) consensus, as of 2026-08-03. Estimate figures are S&P Capital IQ consensus (vendor data — no filing page links). EPS and net income use the normalized (adjusted) consensus where the street reports it. Line-item analyst models (segments, drivers, KPIs) are in the Visible Alpha tab.
Traceability
367 of 387 figures on this page (95%) link to the filing page where they are printed — click a linked figure to open the source PDF at that page with the row highlighted. Unlinked figures come from standardized data feeds or pre-filing years.
Display units are US$ thousands, exactly as printed in the filings ("in thousands, except share and per share data").
Each fiscal year's figures are cited to that year's own Form 10-K: FY2025 pp.95/97/100/111, FY2024 pp.95/97/100/112, FY2023 pp.73/74/77/87, FY2022 pp.73/75/78/88, FY2021 pp.138/140/144/157.
The income statement is titled 'Consolidated Statements of Income' in the FY2024 and FY2025 10-Ks and 'Consolidated Statements of Operations' in the FY2021–FY2023 10-Ks.
Revenue by service offering: the FY2021 10-K labeled the second and third lines 'Content Security' and 'AI Operations'; these were renamed 'Trust Safety' (also printed 'Trust + Safety' in FY2024) and 'AI Services' in later filings. Values are continuous across the rename.
FY2019 and FY2020 columns (long-term record) are comparative columns of the FY2021 Form 10-K (income statement p.140, cash flows p.144).
The provider numeric feed (data/financials) reconciles to the filed statements within rounding for every line; no material discrepancies were found.
Cash-flow 'Depreciation' (e.g. FY2025 $41,526k) differs from income-statement 'Depreciation' ($41,164k) because the cash-flow line includes depreciation capitalized/classified elsewhere on the income statement; both are as printed.
Quarterly Q4 FY2025 income and cash-flow figures are derived (FY2025 10-K full year less Q3 nine-month YTD); Q2/Q3 FY2025 cash-flow quarters are derived by differencing printed YTD statements. All derived values reconcile exactly to data/financials/cash_flow_quarterly.json and income_quarterly.json.
Q1 FY2026 balance sheet reflects a large debt raise (long-term debt rose to $474,540k and total liabilities to $706,667k, with treasury/other equity movements reducing total shareholders' equity to $274,965k).
TaskUs, Inc.'s management explains the business in its own materials. The slides below do the most of that work, pulled from the documents preserved in Sources. Each source link opens the complete presentation at that slide in a new tab.
Investor Presentation — Q1 FY2026 — Q1 FY2026
Management's current company overview: what TaskUs does, its three service lines, geography, its strategy for the AI era, and the numbers. · Open the full document →
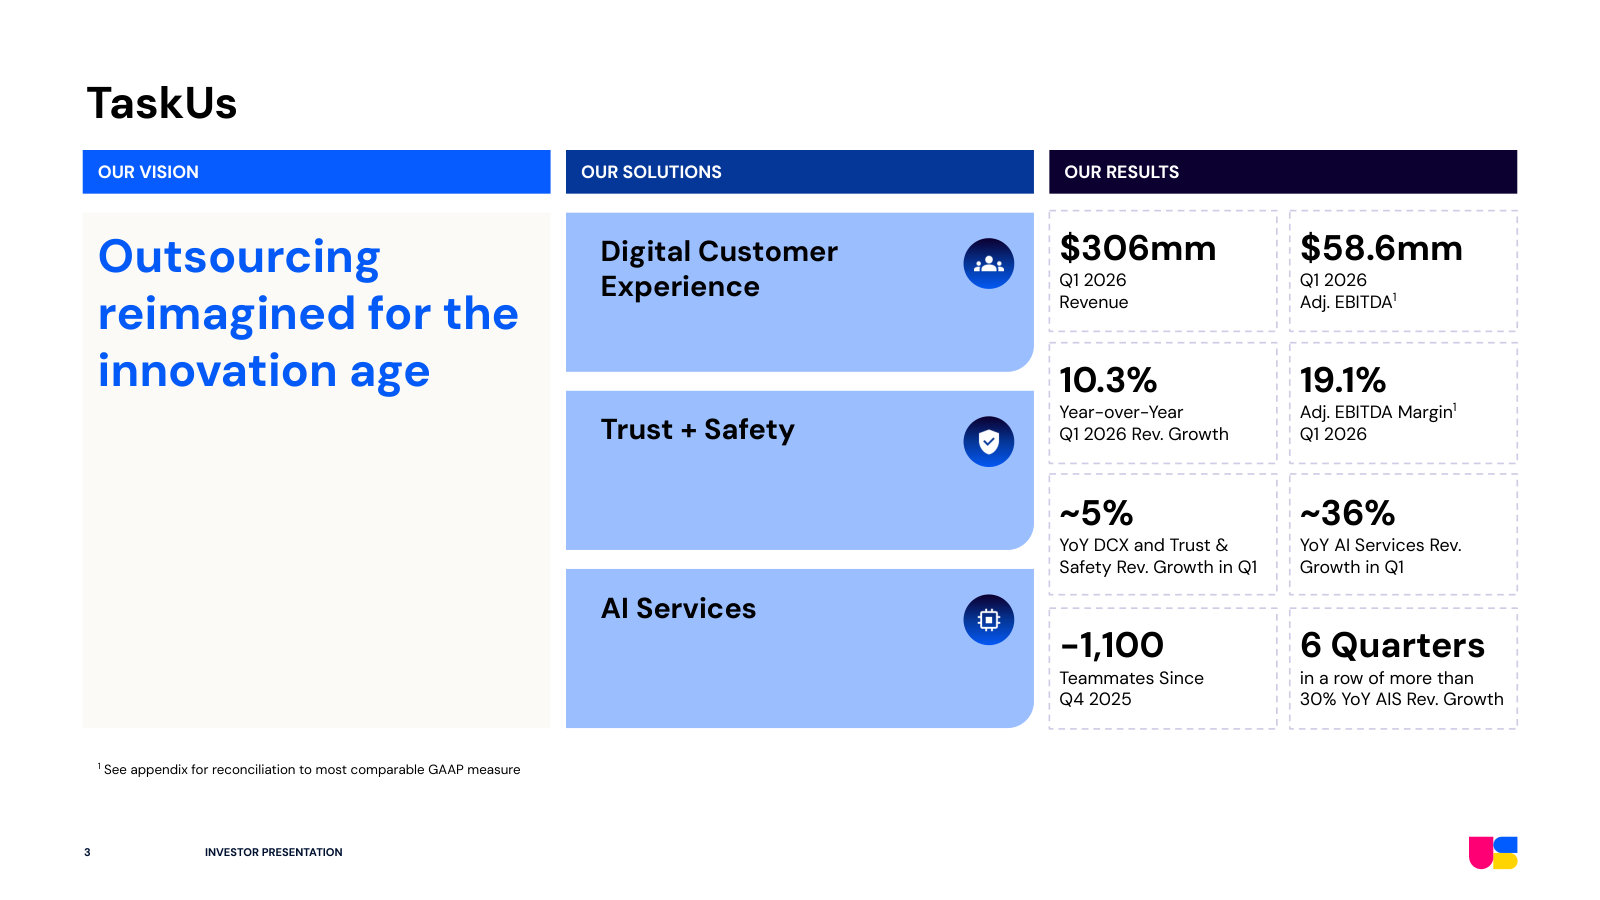
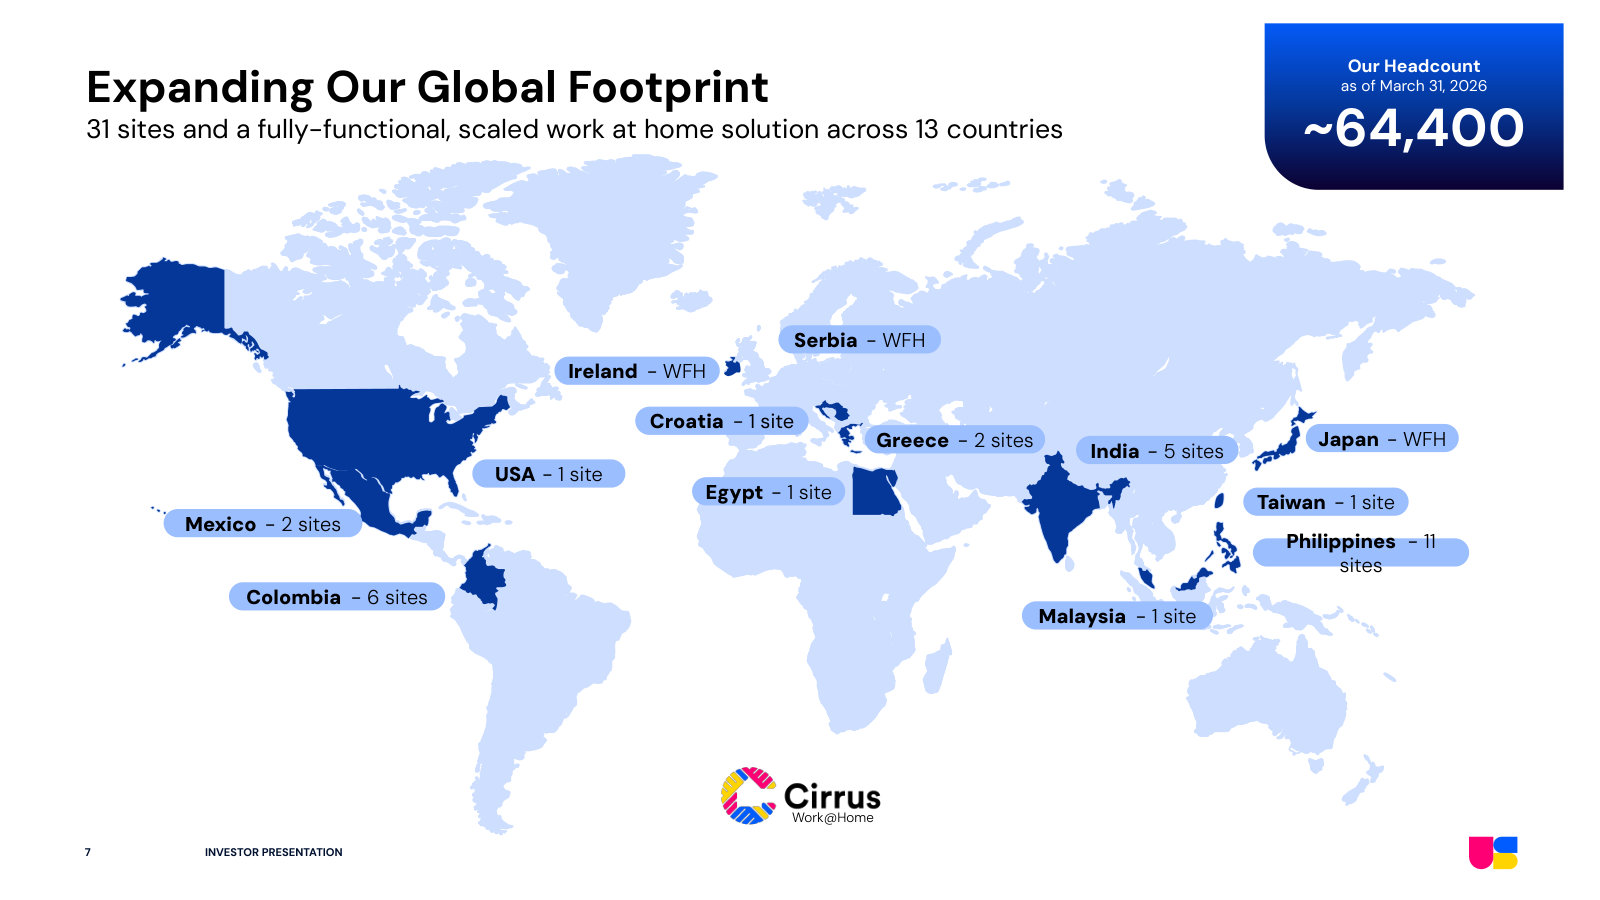
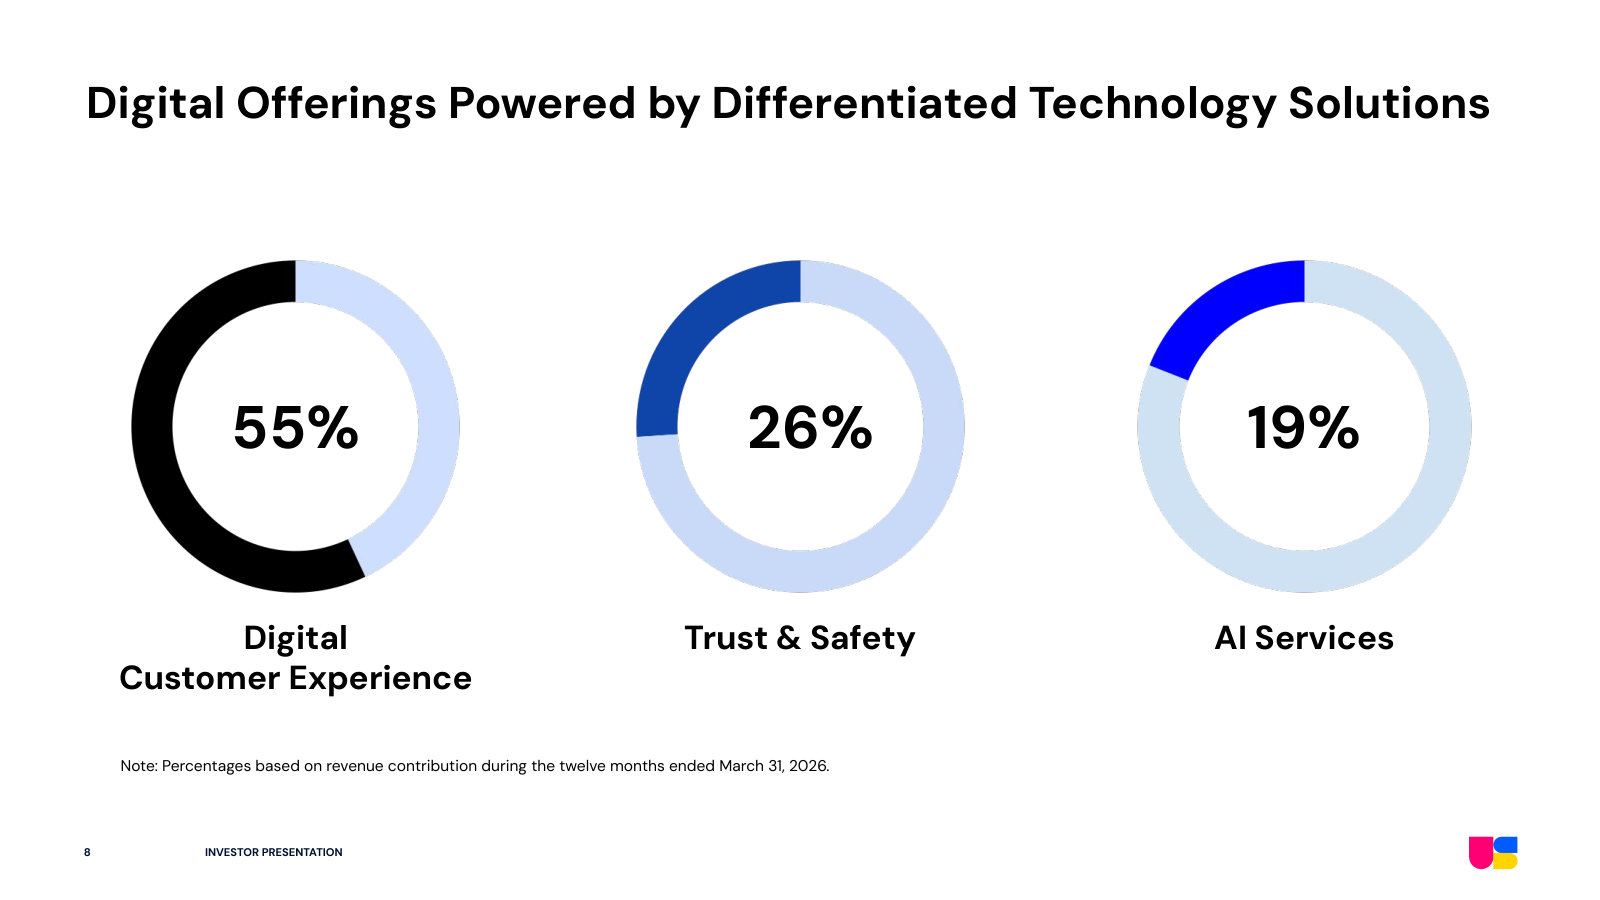
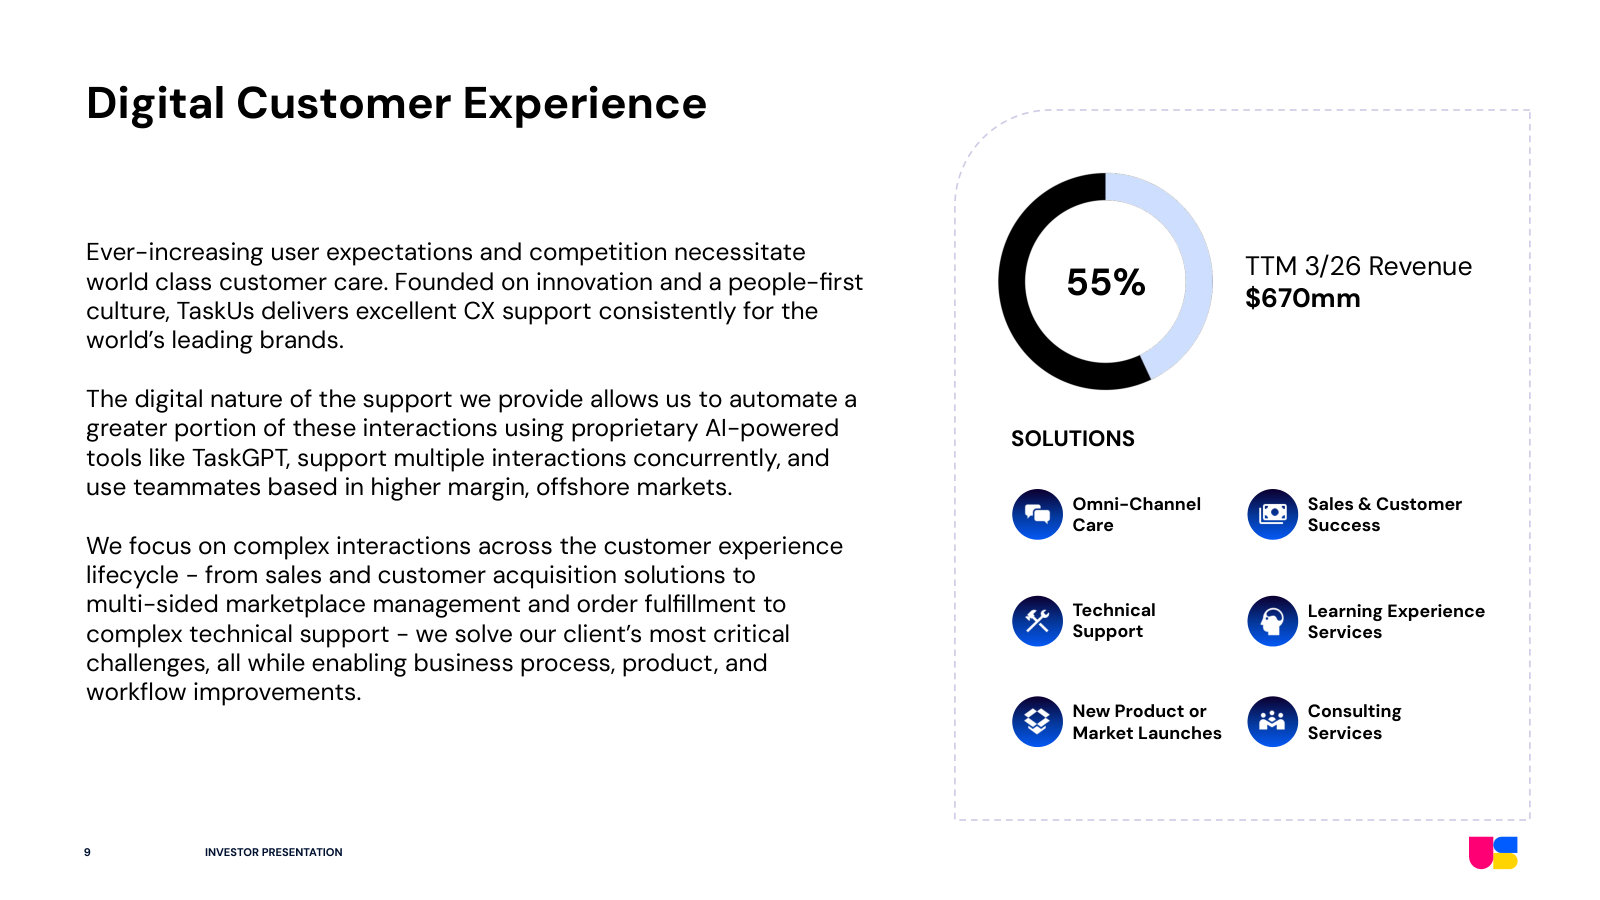
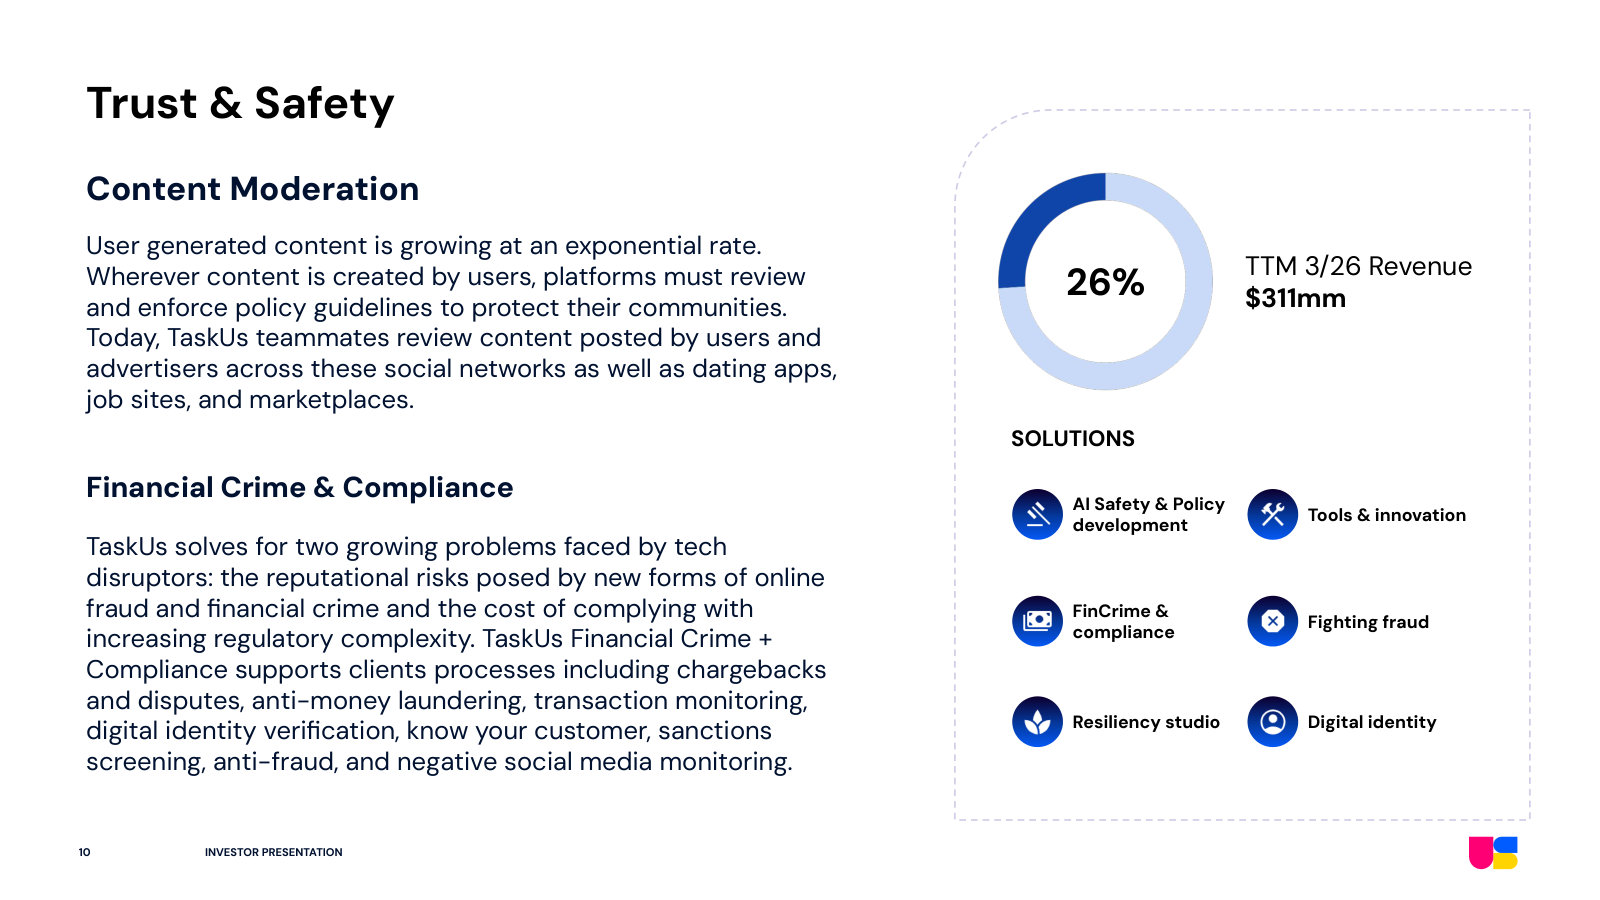
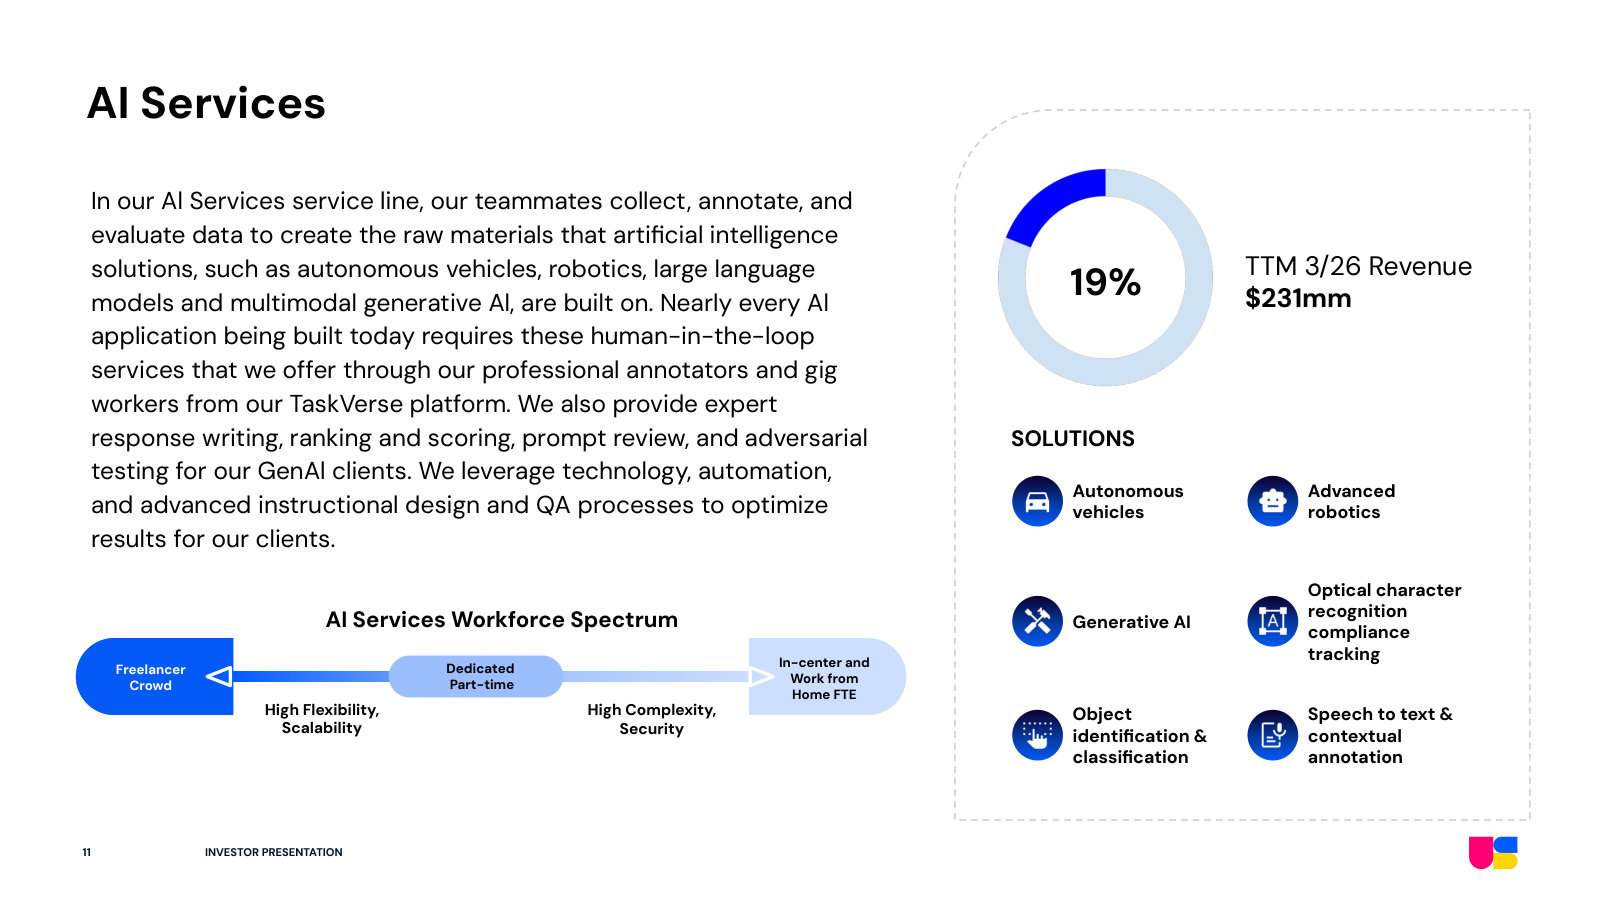
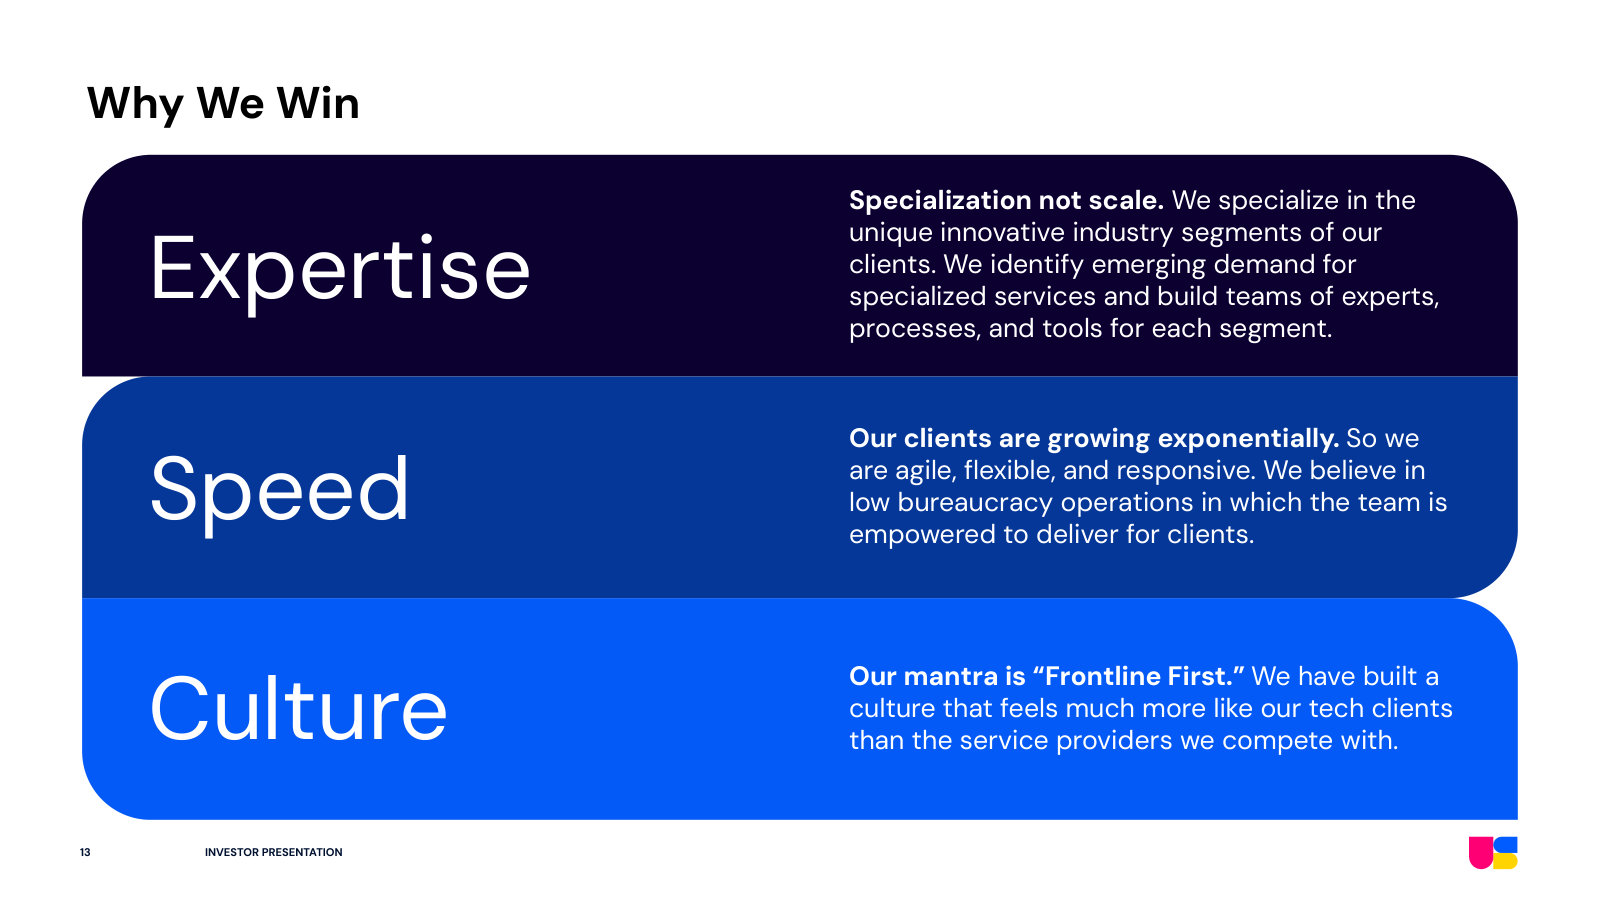
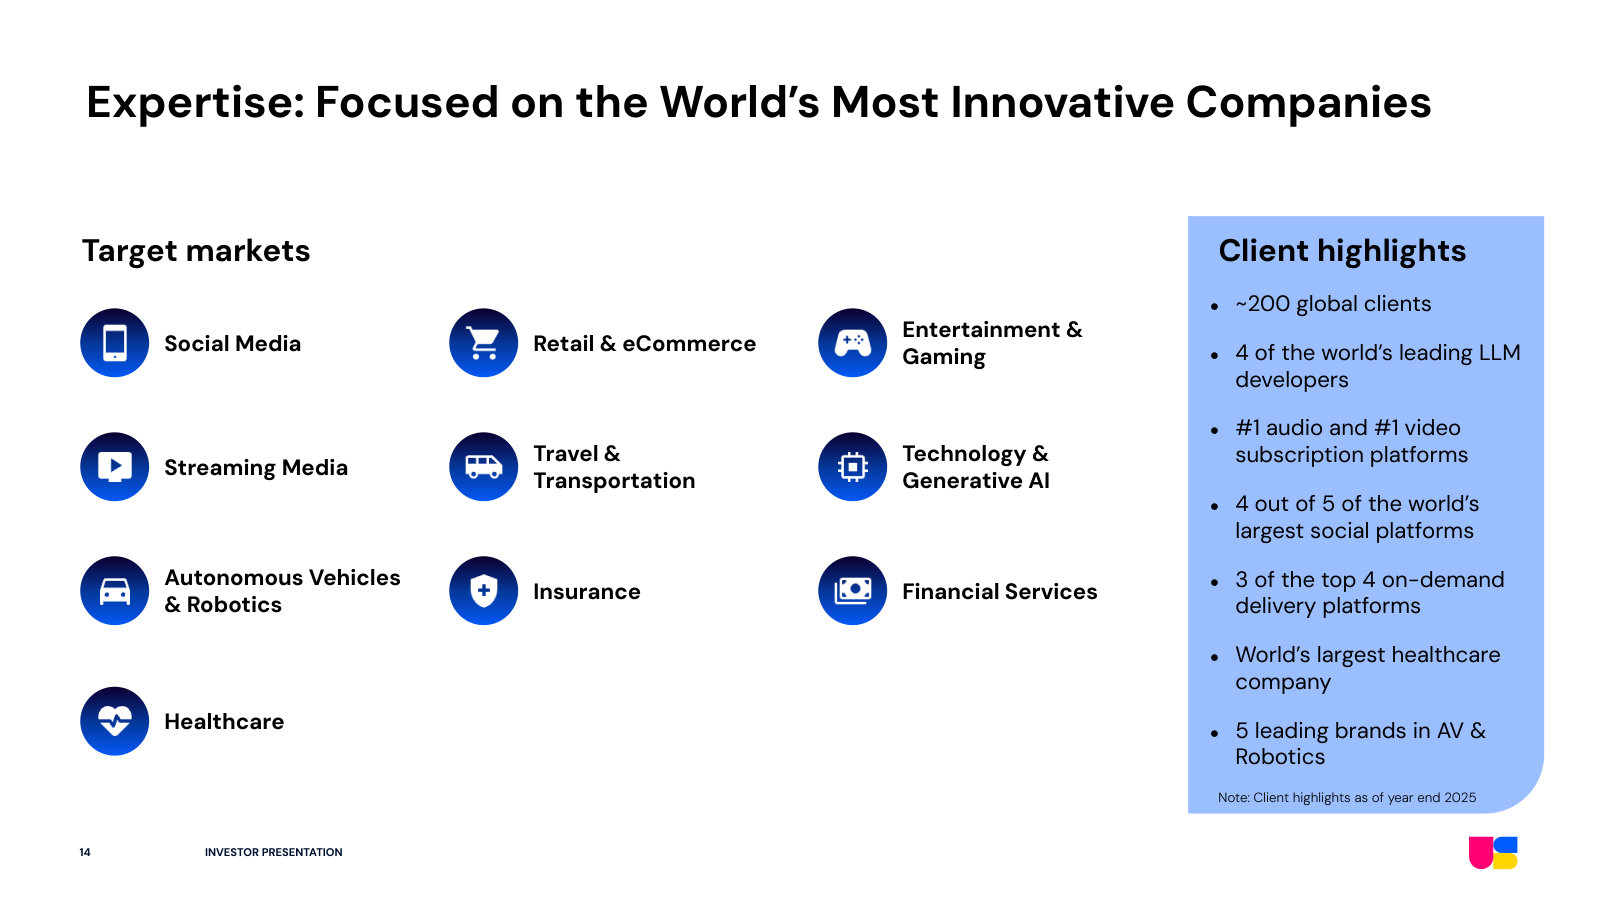
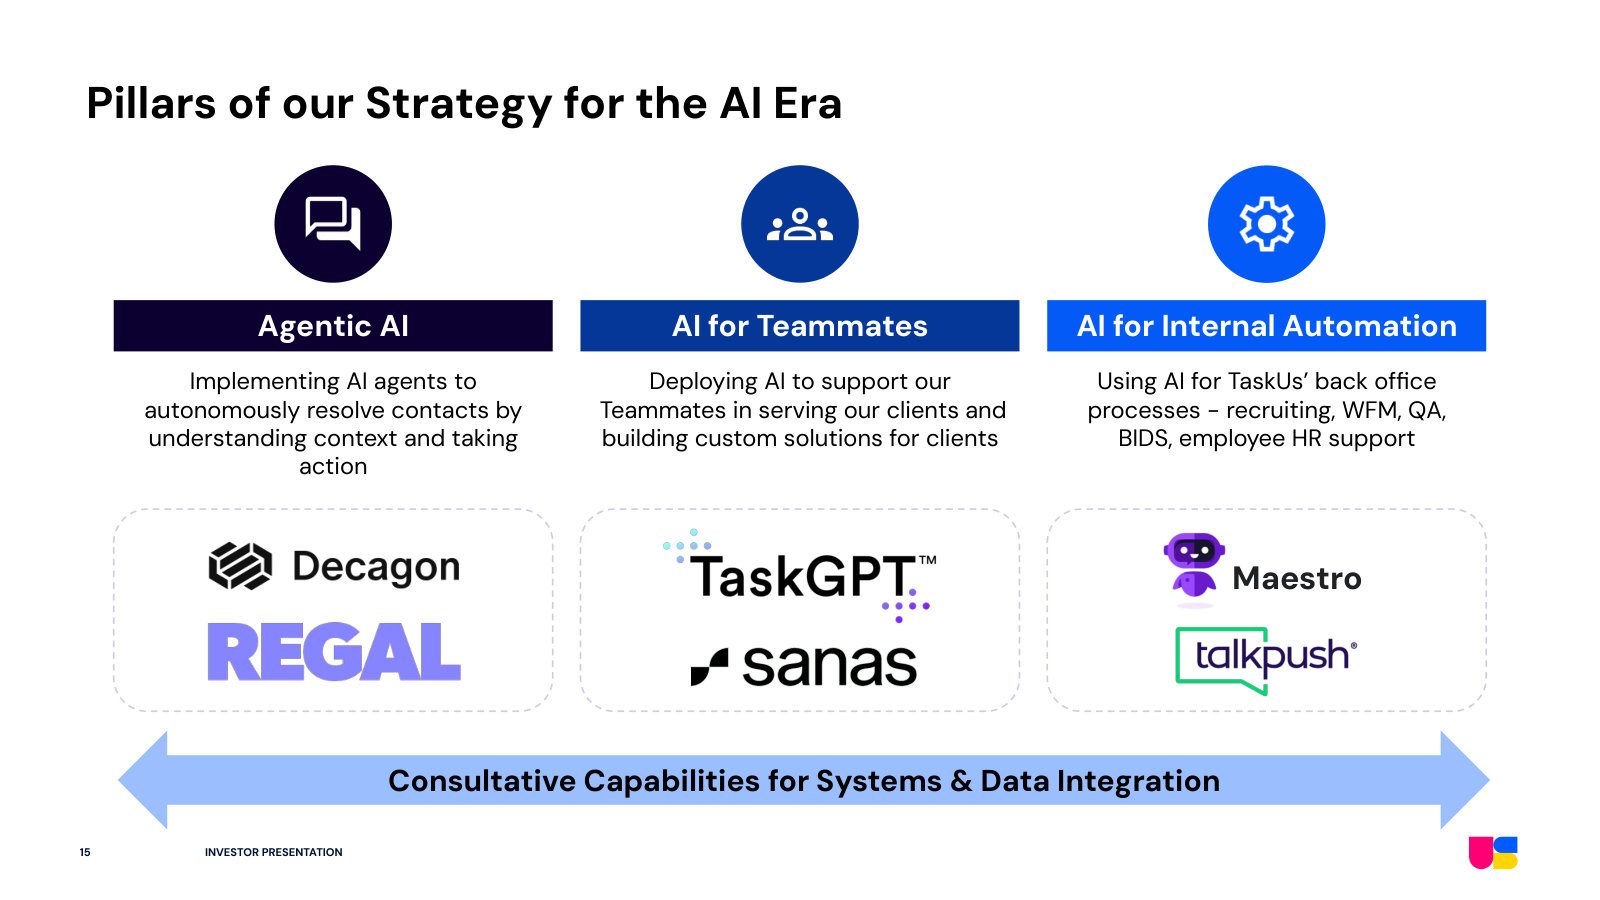
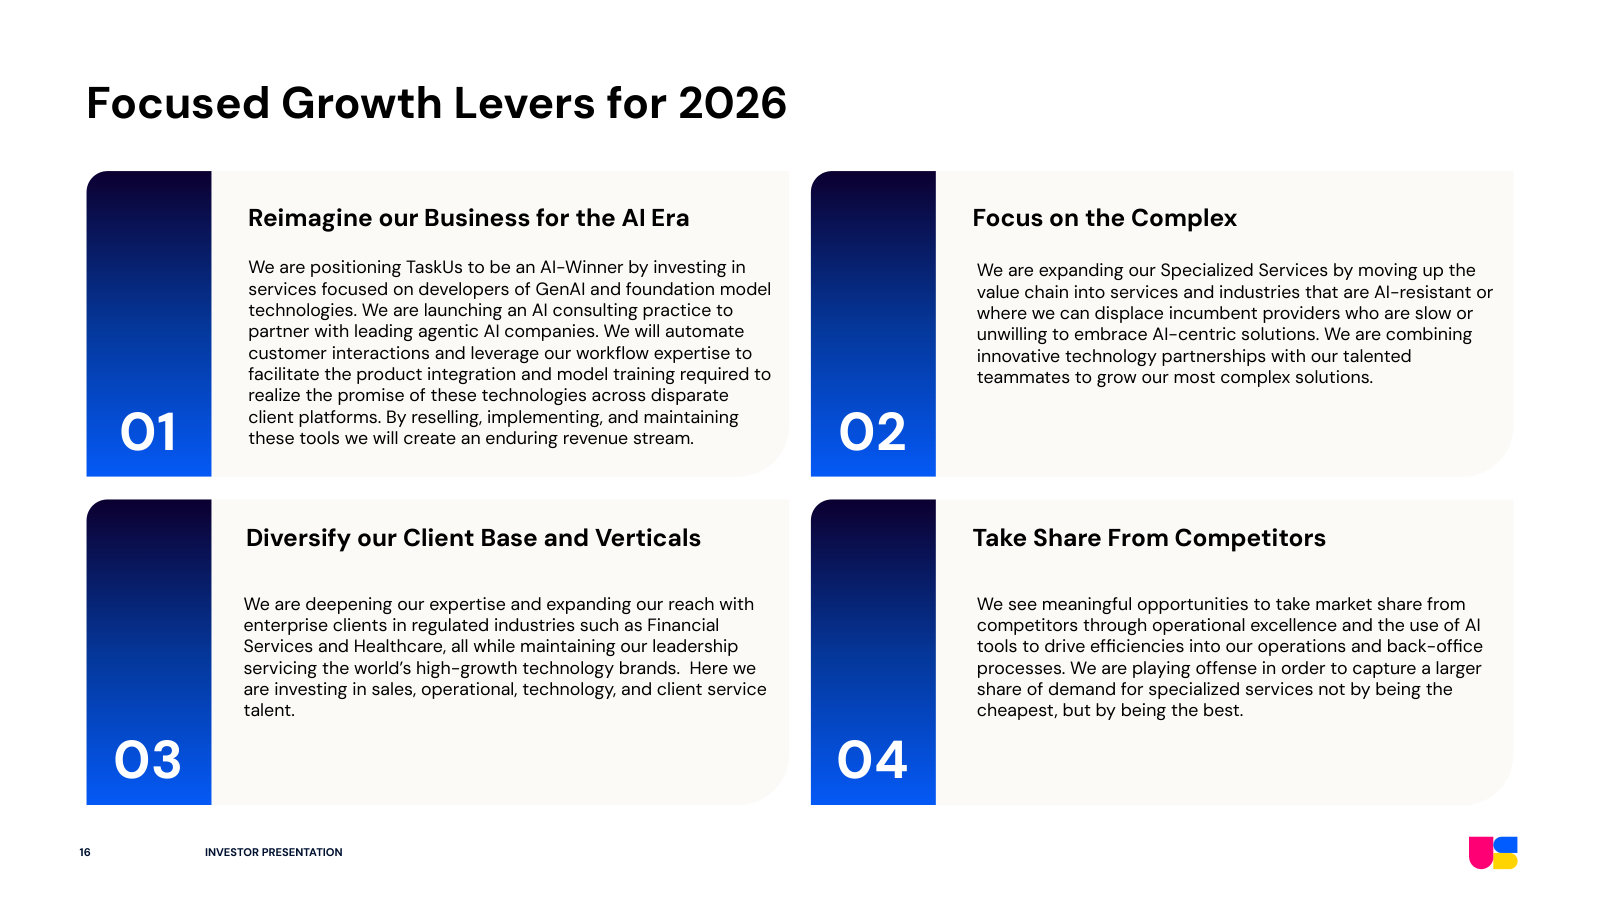
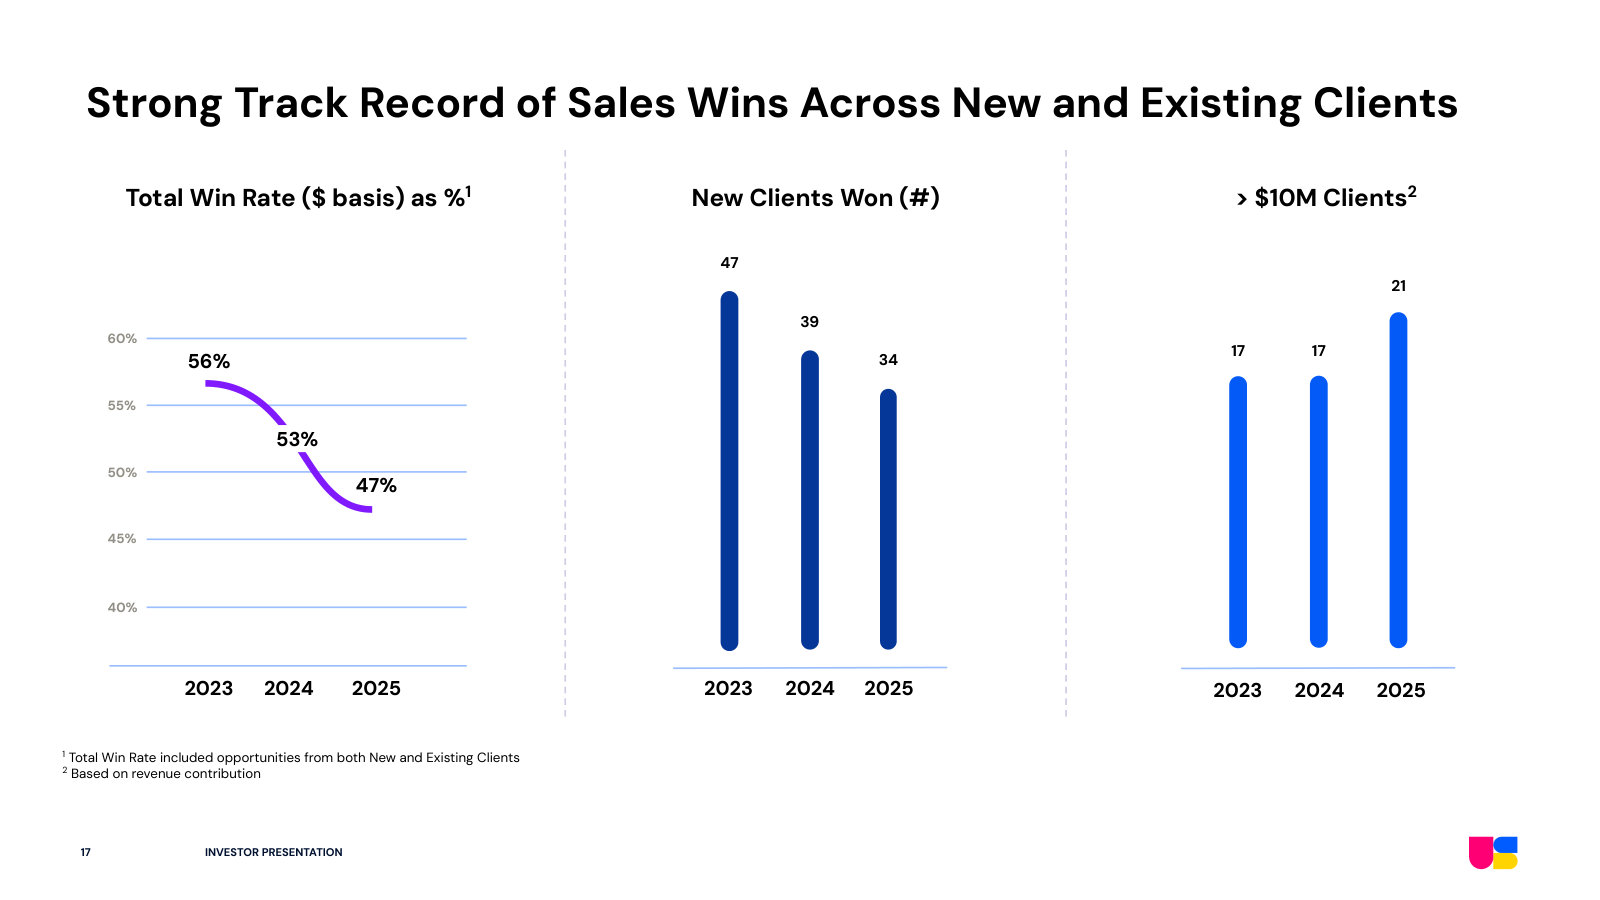
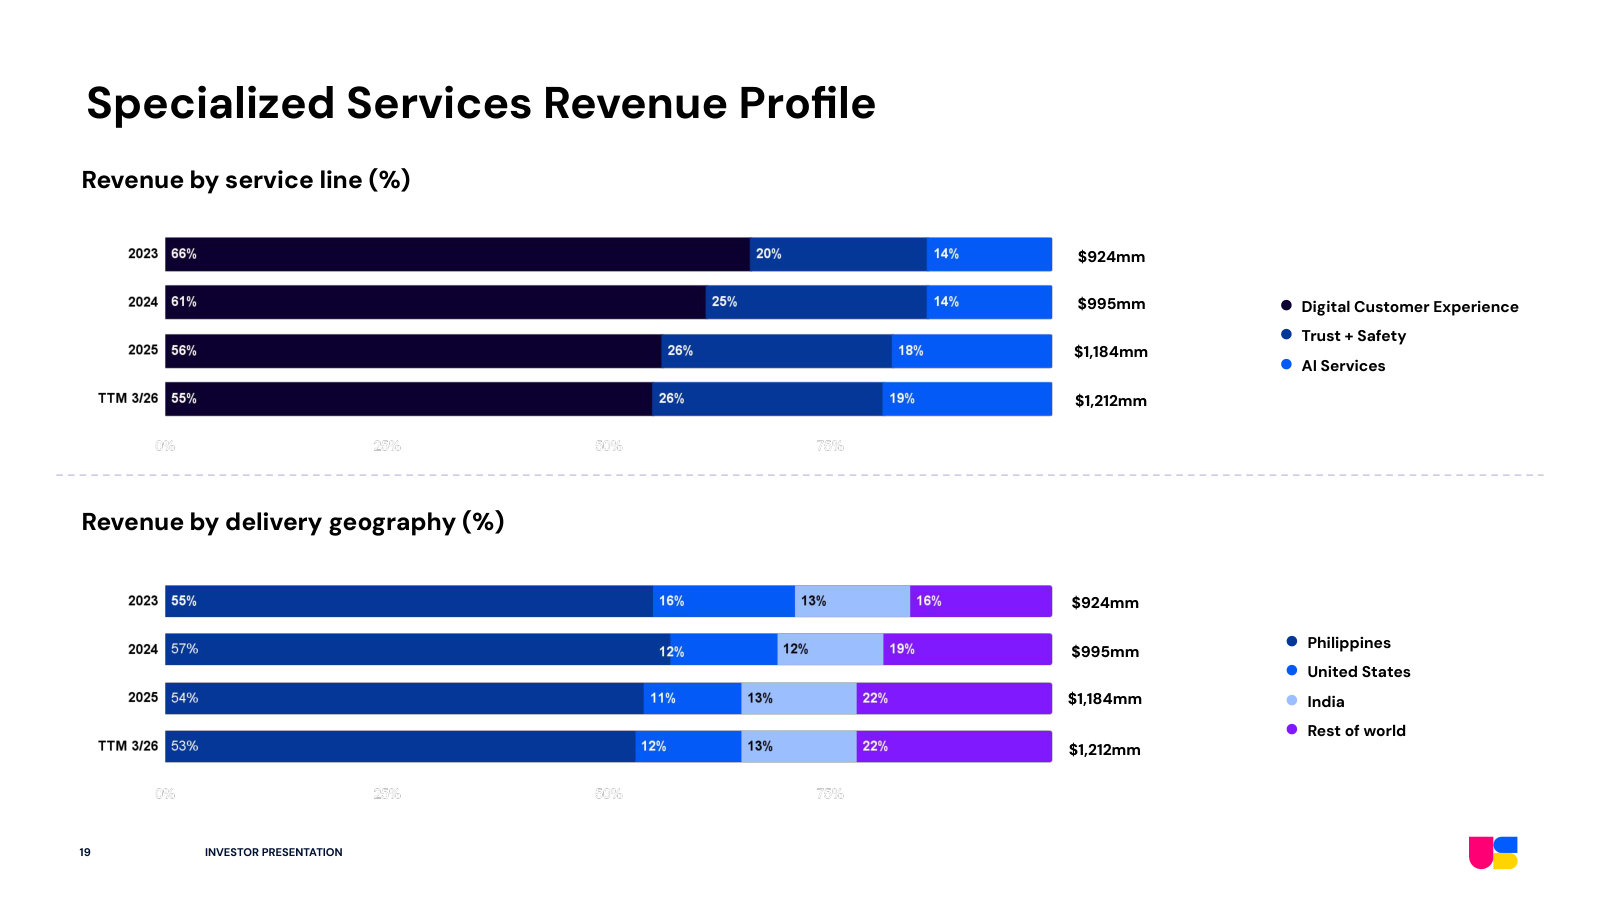
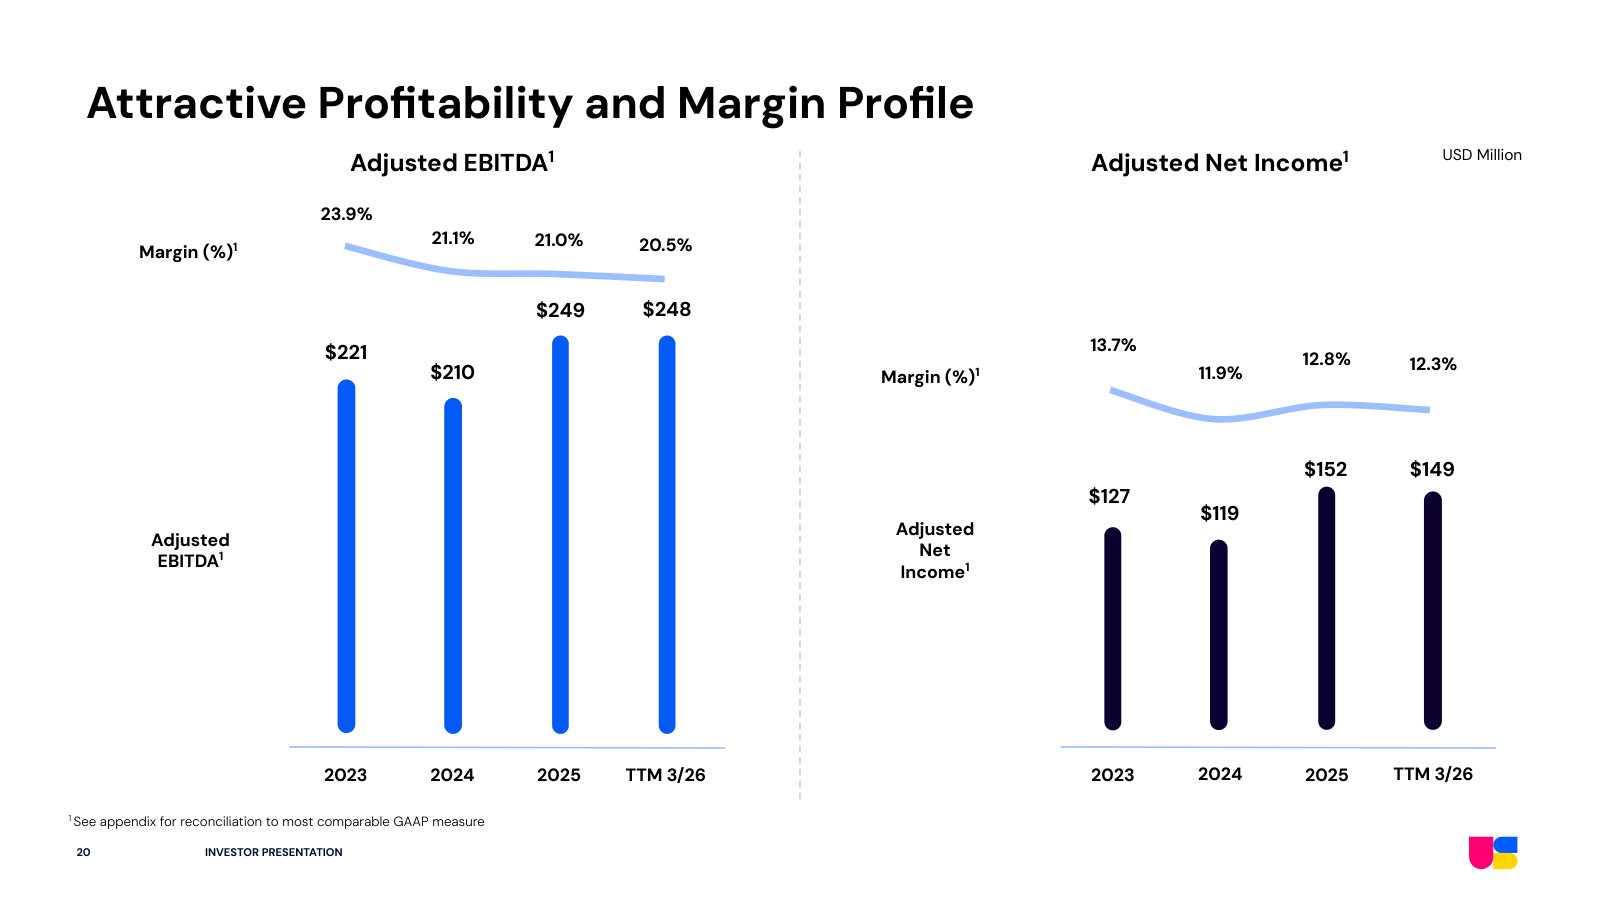
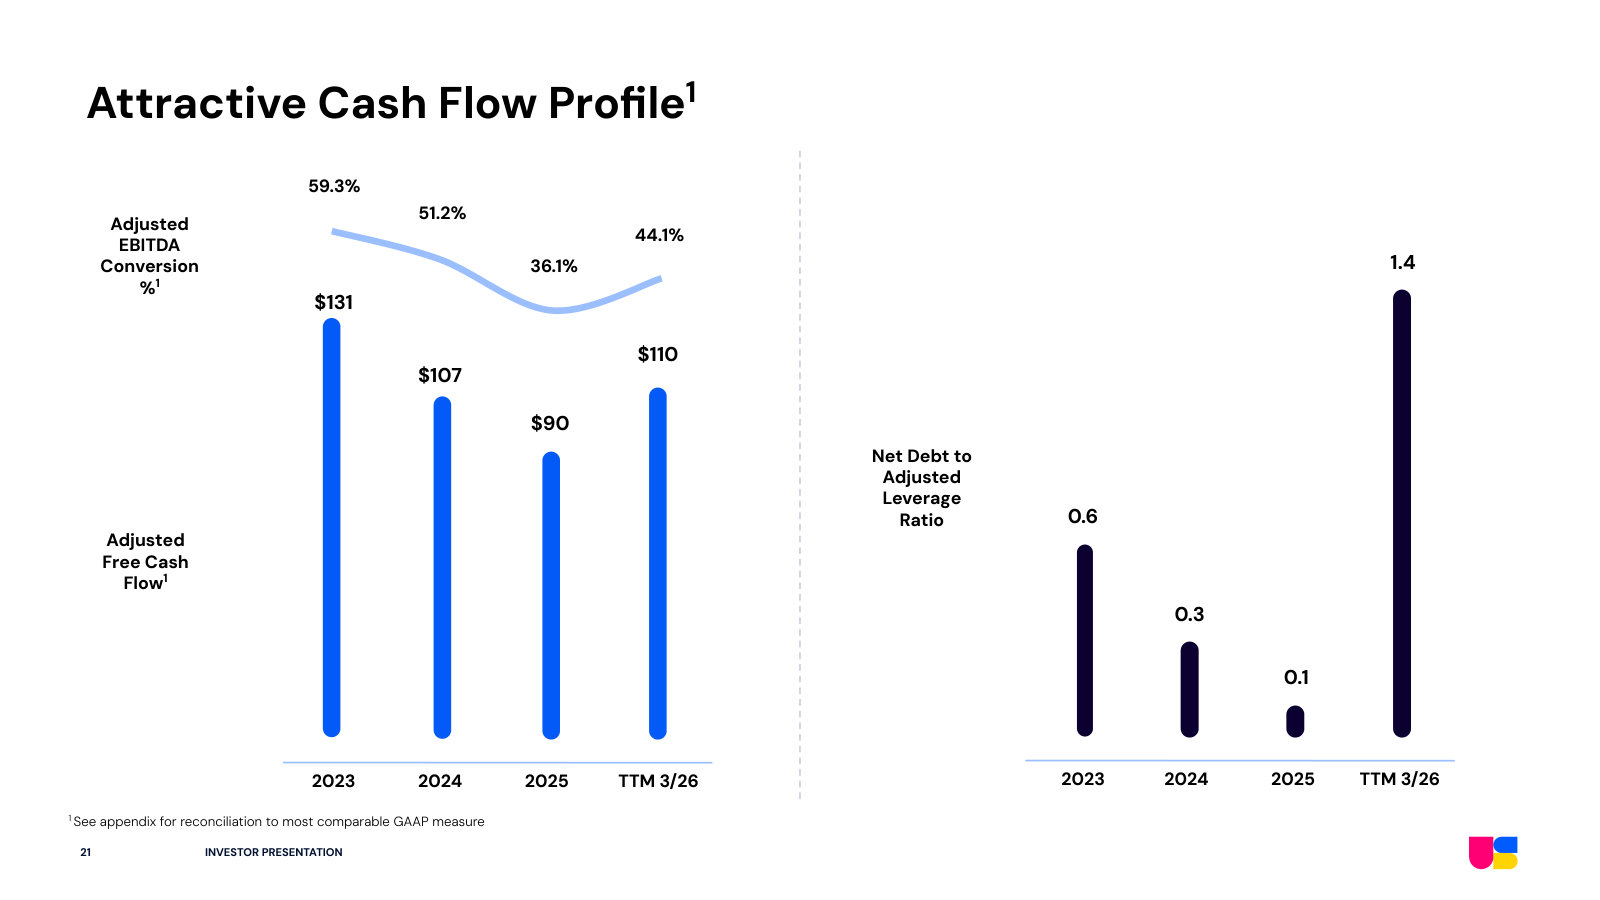
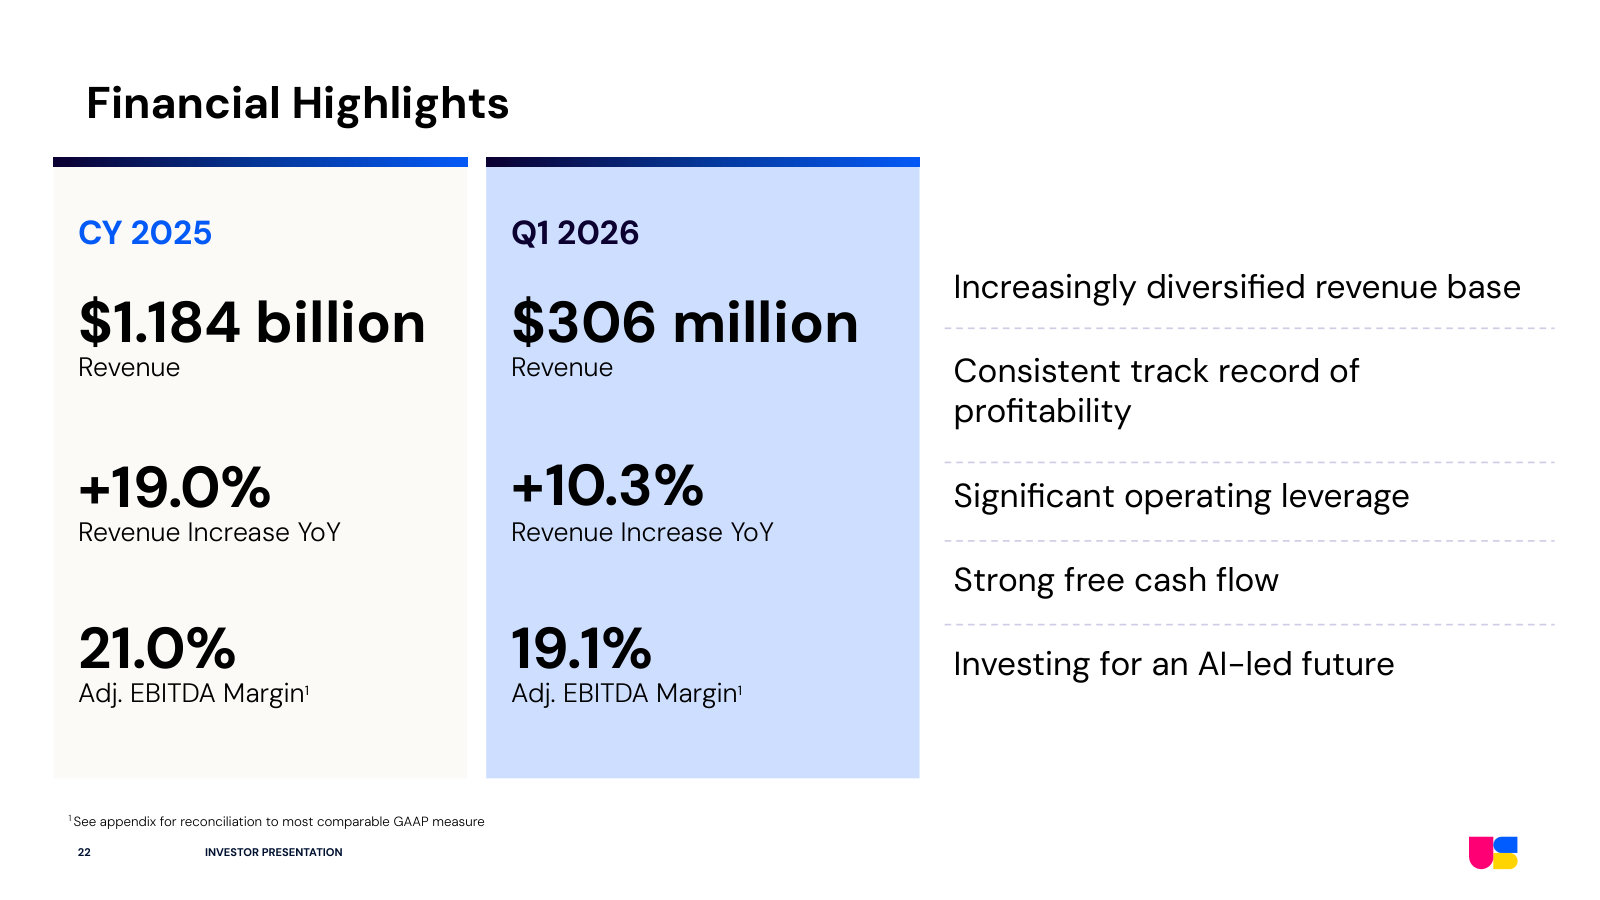
More from management
Investor Presentation — Q4 FY2025 — Q4 FY2025 · 30 pages · The year-end FY2025 edition of the same deck — full-year 2025 results as management framed them at year-end, before the Q1 FY2026 refresh. · Open →
Investor Presentation — Q1 FY2024 — Q1 FY2024 · 32 pages · The earliest edition on file — pre-AI-era framing, when 'take share from competitors' led the growth story rather than the AI pivot. · Open →
TaskUs, Inc.'s management answers for the business every quarter. These are the exchanges that explain it best — verbatim, from the call transcripts preserved in Sources. Each link opens the full transcript at that page in a new tab.
Q1 2026 Earnings Call — Q1 2026
The clearest read on how the AI transition actually pays: outcome-based pricing, the largest client’s automation-driven decline, and the AV/robotics practice management expects to triple. · Open the full transcript →
A live example of the agentic-AI consulting model: autonomous agents resolve streaming issues, freeing humans for higher-value work.
Bryce Maddock (Co-Founder & CEO): Turning to the second pillar of our AI strategy, investments in our AI consulting practice, I want to highlight an example of our operational evolution with a streaming service client. This client challenged TaskUs to deploy AI agents to improve their time to resolve while dropping their overall support costs. In just a few weeks, we successfully integrated Agentic AI to transform the client's support ecosystem. Rather than simply routing tickets, our AI agents autonomously navigate the client's back-end systems to diagnose streaming and account issues across various hardware environments. By deploying autonomous agents, we're not only providing subscribers with instantaneous 24/7 resolution, but are also allowing our human teammates to focus on highervalue sales and retention workflows.
p. 1 · Read in context →
How TaskUs plans to make money on AI: reselling partners today, moving to a single outcome-based price it controls.
Puneet Jain (JPMorgan); Bryce Maddock (Co-Founder & CEO): Can you talk about your expectations of contract margin and revenue profile over its life when you provide AI consulting services to an existing DCX customer? […] We're investing heavily upfront in every one of our AI consulting engagements. The goal is to drive these consulting engagements towards outcomebased pricing arrangements in which we combine both technology and talent in a single price per solution. […] in all of those cases, we're acting as a reseller for our partners, Decagon and Regal, and marking up the preferential pricing that we're able to get from them. […] long term, we're hoping that we can wrap the AI solution as a single price for both the technology solution and the talent solution, getting paid for resolving cases. We think that will put us in control of our margin profile and really incentivize us to expand margins by driving greater AI efficiency gains.
p. 6 · Read in context →
Why AI Services is the growth engine — and how big it can get against rivals already at $1bn-plus.
Puneet Jain (JPMorgan); Bryce Maddock (Co-Founder & CEO): This is the brightest spot in our business at the moment: our AI Services practice. In Q1, for the sixth quarter in a row, that practice grew at over 30% year-over-year. And we absolutely can double, if not more than double, the size of this business. When we look out across the space, there are a number of players that have scaled into the hundreds of millions, if not $1 billion-plus revenue, driven primarily or exclusively from AI Services. We're competing with those players today for the work that we're doing for foundational models and social media companies.
p. 6 · Read in context →
The thesis test: is the largest client’s automation on plan, and where does the spend stabilize?
Jonathan Lee (Guggenheim); Bryce Maddock (Co-Founder & CEO): At quarter end, is the pace of decline tracking to plan or accelerating? And can you size a floor where their outsourced spend may stabilize, especially given your expectation of benefit from vendor consolidatio there? […] At this stage, we've continued to have conversations regularly with our largest client. And we know that their plans and investments are all driven towards automating large swaths of the work that are currently done by outsourced vendors. We're in a privileged position given the geographic footprint that we've got for the client that aligns with where they're taking the business strategically in the future. And they've continued to reaffirm their commitment to consolidate share with us amongst a small handful of other vendors over time. So what we're seeing in these numbers is the original plan that we expected in terms of automation taking a portion of the volumes over the course of 2026. As we head into 2027, we expect to benefit from vendor consolidation. The uncertainty we talked about on the call really comes down to the pace of that automation and whether it accelerates beyond those initial expectations.
p. 7 · Read in context →
Where the fastest growth sits — AV live operations and early-stage robotics data — and candor on a prior miss.
Matt Dezort (William Blair); Bryce Maddock (Co-Founder & CEO): Within AI Services, this is the place that's growing the fastest: the work that we're doing for autonomous vehicles and robotics. We're seeing an incredible amount of investment go into this space. The autonomous vehicle rollout is much further along in its development. We've gone from, five to seven years ago, a period of collecting and annotating data to a period in which we're actually doing live, remote and field operations to actually bring these vehicles to customers and ferry customers around cities and the scale that's happening in that space over the next year is going to be pretty exponential. Inside robotics, we're closer to where we were, say, five years ago in autonomous vehicles where the focus is primarily on data collection, data annotation and evaluations to get these physical AI models to work effectively. […] We've seen other players inside AI Services build businesses that are worth hundreds of millions, if not billions of dollars around the expert answer space. A number of players help foundational models with recruiting experts. TaskUs did okay in that space, but it wasn't our core business. And so I would say that we didn't deliver as well as I would have hoped. But when it comes to this robotics opportunity, we are determined not to miss the opportunity
p. 8 · Read in context →
Q4 2025 Earnings Call — Q4 2025
The strategy call: a $333m special dividend and refinancing on the view the market undervalues TaskUs, the full three-part AI plan, and the shift from selling hours to selling outcomes. · Open the full transcript →
Capital allocation: a special dividend and refinancing, framed as returning capital while an undervalued stock keeps investing.
Bryce Maddock (Co-Founder & CEO): we also declared a $3.65 per share special dividend payable to all shareholders in March of 2026. […] these actions are consistent with our desire to return capital to shareholders at a time when we believe the market has fundamentally undervalued our strong track record of performance, including our healthy balance sheet and our consistent revenue, earnings and cash flow generation. […] Importantly, this dividend does not change our plans to invest aggressively to transform our business for the AI era.
p. 1 · Read in context →
The new business model in one paragraph: one price per contact, a guaranteed 100% resolution, TaskUs earns margin by making the AI better.
Bryce Maddock (Co-Founder & CEO): In 2026, we expect to begin selling technology plus talent as a combined offering. Here, rather than paying one price for AI agents and another price for humans, our clients will pay a single price per contact. TaskUs will guarantee a 100% resolution rate and meaningful per contact savings from day one. In exchange, our clients will allow us to deploy AI agents. It will be our responsibility to earn back the cost savings and additional margin by increasing the effectiveness of AI agents in these workflows. This model delivers immediate and guaranteed cost savings to clients frustrated by slow AI gains while giving TaskUs the opportunity to expand margins over time.
p. 3 · Read in context →
Pricing power and its limit: premium positioning, but onshore AI work carries lower margins.
Antonio Jaramillo (Morgan Stanley); Bryce Maddock (Co-Founder & CEO): The pricing environment is definitely dynamic at the moment. Given the slow rate of growth in the overall industry, there is more competitiveness in pricing really over the last, I'd say, 18 months than we've seen historically. With that being said, we feel like we're in a premium position, particularly in the services that we're offering in AI Services and some of the premium customer support services that we're offering. […] a lot of the work that we're going to be doing in the AI Services space is going to be done onshore. And so as a result of that growth, we tend to have lower margins in our onshore environments versus our offshore environments.
p. 8 · Read in context →
Replace or add? Bryce answers with TaskUs’ own history of automation and the move from charging for hours to charging for outcomes.
David Koning (Baird); Bryce Maddock (Co-Founder & CEO): historically, our industry and our business have seen consistent trends of automation and reinvention. And if I think back to when we started TaskUs, the first few clients we had were doing things like transcribing voicemail messages or transcribing receipts, things that have been automated for well over a decade now. And we've been able to grow the business by discovering emergent forms of demand and then going into those forms of demand and developing a real expertise. […] if we look forward a few years to what our customer experience business will look like, it really is going to be that technology plus talent solution-based business. We're going to see our business evolve away from charging for hours to actually charging for outcomes where TaskUs owns the end-to-end experience, whether it's solved by an AI agent or a human expert.
p. 9 · Read in context →
Q3 2025 Earnings Call — Q3 2025
The call after the shock: shareholders rejected the $16.50 take-private as too low, and management reset around an AI-era transformation. · Open the full transcript →
Margin philosophy: gross margin has slipped on geo mix and pricing, defended by automating internal support.
David Koning (Baird); Bryce Maddock (Co-Founder & CEO): there has been a decline in the gross margin over the last few years. It's a combination of diversification of geographic delivery and just a more dynamic pricing environment that we've seen as the industry itself has slowed in terms of growth. I'm very proud of the disciplined approach our team has taken to optimizing our G&A spending in particular and being able to more than offset any gross margin decline to defend the adjusted EBITDA line. […] in this last month, the number of hires per recruiter at TaskUs was the highest it's been in our company's history and that's because we've automated the entire candidate pipeline up until a face-to-face interview.
p. 7 · Read in context →
With a clean balance sheet, why not buy back 10% of shares? Transformation comes first.
David Koning (Baird); Bryce Maddock (Co-Founder & CEO): Your balance sheet has become very clean. You're roughly neutral cash debt position now. You can kind of take next year's cash flow, put it all into buybacks and buy back almost 10% of the shares at the current price. Like does that start entering your mind? Or are there other uses of cash you're thinking about? […] right now, the primary use of cash is going to be on this AI transformation. We're very fortunate to have a very clean balance sheet and a net debt position that on the current trajectory, we think will basically be net debt free at some point in Q1. So I think the first thing we're going to do is take the healthy cash flow the business generates and invest a significant portion of that into our Agentic AI consulting practice, into growing our AI services business, into continuing to transform the core of our business and really be as aggressive as we can in those investments.
p. 8 · Read in context →
Q4 2024 Earnings Call — Q4 2024
Where the AI-era blueprint was first laid out — the winners-and-losers framing, the red-teaming AI Services business, and the largest client named as Meta. · Open the full transcript →
The thesis in one line: commodity BPO gets “automated into oblivion,” complex/AI-support providers can grow double digits.
Bryce Maddock (Co-Founder & CEO): Over the next five years, AI is likely to fundamentally reshape our world. There are considerable fears about what this means for the BPO industry. Our view is that our industry will have both winners and losers. BPOs that remain focused on simple, repeatable customer interactions and processes will be automated into oblivion, while those that provide more complex services and develop new revenue streams supporting the AI revolution will have the opportunity to achieve durable double-digit growth while preserving or even expanding their margins. At TaskUs, we intend to be an AI winner.
p. 3 · Read in context →
What AI Services actually is — from tagging street images a decade ago to red-teaming frontier models today.
Bryce Maddock (Co-Founder & CEO): demand for AI services has transformed faster than any service I have ever seen. When we started this practice a decade ago, we were focused exclusively on autonomous vehicle development, tagging images of streets to teach cars how to drive. Over the past few years, the development of foundation models has exploded […] As AI safety has become a critical concern, the demand for AI red teaming has also surged. In this process, our diverse and specialized teams rigorously test AI models, probing for weaknesses, biases, and potential misuse. They use adversarial techniques to stress test the models attempting to elicit responses that violate terms of service or enable harmful behaviors.
p. 4 · Read in context →
The concentration question on Meta, and exactly what TaskUs’ trust-and-safety work is — and isn’t.
Jim Schneider (Goldman Sachs); Bryce Maddock (Co-Founder & CEO): I was wondering if you could give us a bit of an update on your largest customer, Meta. And understanding that you do not participate in the fact checking work, which the company did. Maybe give us a sense about as the company revisits its fact checking and content moderation policies, how you're thinking about the potential risks to Task’s existing business and how you plan to mitigate them? […] we don't provide fact checking services to our largest client or any other client for that matter. Generally, our trust and safety business is focused on solutions to ensure content posted complies with client policies. […] we work to remove illegal content such as terrorism activity and child endangerment. We also tackle toxic content that could include bullying, graphic violence, and sexually explicit material. […] As far as the risk, at this stage, we don't see any significant risk. Revenue from this client grew faster than the overall business in 2024.
p. 8 · Read in context →
Why headcount outgrew revenue: the mix shift out of high-yield U.S. delivery toward offshore geographies.
David Koning (Baird); Bryce Maddock (Co-Founder & CEO): this year, we've seen a mix shift. I'm really proud that we got back to double-digit growth in the U.S. in Q4. That was not the case for most of the year. For most of the year, our revenue in the U.S. was declining and obviously the U.S. is the region in which we drive the highest revenue per employee. And so, as we look at growth being driven in the Philippines and India and increasingly in new regions like Colombia and even parts of Europe, revenue per employee is just lower than it was in the U.S. business.
p. 10 · Read in context →
Q1 2024 Earnings Call — Q1 2024
The earliest call in the set — the original “playing offense” GenAI framing before any formal strategy, and the claim that new AI demand outruns automation losses. · Open the full transcript →
The founding bet: no revenue lost to client GenAI yet, and new demand will “more than make up” for automation.
Bryce Maddock (Co-Founder & CEO): To date, we have not experienced any material impact on our revenues from clients directly leveraging GenAI to automate processes we currently support. Meanwhile, the development and maintenance of these technologies have increased demand for our specialized services. […] We're playing offense, supporting our client automation efforts, while capturing a larger share of the demand for the specialized services that support and protect their use of GenAI. […] GenAI is going to have a transformative impact on our business in the years to come. We believe it creates significant opportunities for us and that these opportunities will more than make up for the impact of successful automation efforts.
p. 2 · Read in context →
Reality check on client GenAI adoption: mostly experimental, no material revenue hit, upside from selling GenAI services.
Ryan Potter (Citi); Bryce Maddock (Co-Founder & CEO): we have seen a number of clients deploy Generative AI themselves in various ways. Some of these initiatives have driven modest efficiency increases. But I would classify most of the work that we've seen from our clients as in the experimental stage at this phase. And so we have not yet seen any material impact to revenue as a result of clients deploying Generative AI and automating volumes. […] But we have seen an uptick in demand for our GenAI-related services, whether that's Trust and Safety or AI services to support those models. So we fully expect that we will see an increase in efficiency gains, both from TaskGPT and our AssistAI platform, as well as from our clients own initiatives, but we continue to expect that those will be exceeded by the gains that we get from selling GenAI services to our customers.
p. 7 · Read in context →
More calls
Q3 2024 Earnings Call — Q3 2024 · 9 pages · Go here for the competitive backdrop — rivals “playing defense” and cutting guidance while TaskUs takes share — and how election-year work flowed through trust and safety. · Open →
Q2 2024 Earnings Call — Q2 2024 · 12 pages · The mechanics of the return-to-growth inflection: the top client re-accelerating, near-shore Latin America demand, and Bryce’s candor that TaskUs underperformed peers in AI Services. · Open →
TaskUs, Inc.'s annual reports contain management's most considered account of the business. These are the sections, passages and visual pages worth opening in the originals preserved in Sources.
TaskUs, Inc. — FY2025 Annual Report (Form 10-K) — FY2025
Latest 10-K: the fullest account of the three service lines, the Meta/offshore concentration, and how AI is both engine and threat to a BPO. · Open the full document →
Item 1. Business — Overview — p. 8 · Read the full section →
Defines the model in one place: three services, ~200 clients, and the FY2025 revenue mix (Digital CX 56%, Trust & Safety 26%, AI 18%).
What TaskUs does and how revenue splits across its three service lines.
We deliver outsourced digital services that power the companies shaping the future. By combining specialized human talent and intelligent technology, we solve complex operational challenges for global category leaders within AI, autonomous vehicles, robotics, social media, financial services, healthcare, and beyond. […] As of December 31, 2025, we supported approximately 200 clients. […] For the fiscal year ended December 31, 2025, Digital Customer Experience, Trust & Safety and Artificial Intelligence Services represented 56%, 26% and 18%, respectively, of our total service revenue of $1,183.5 million compared to 61%, 25% and 14%, respectively, of our total service revenue of $995.0 million for the year ended December 31, 2024.
p. 8 · Read in context →
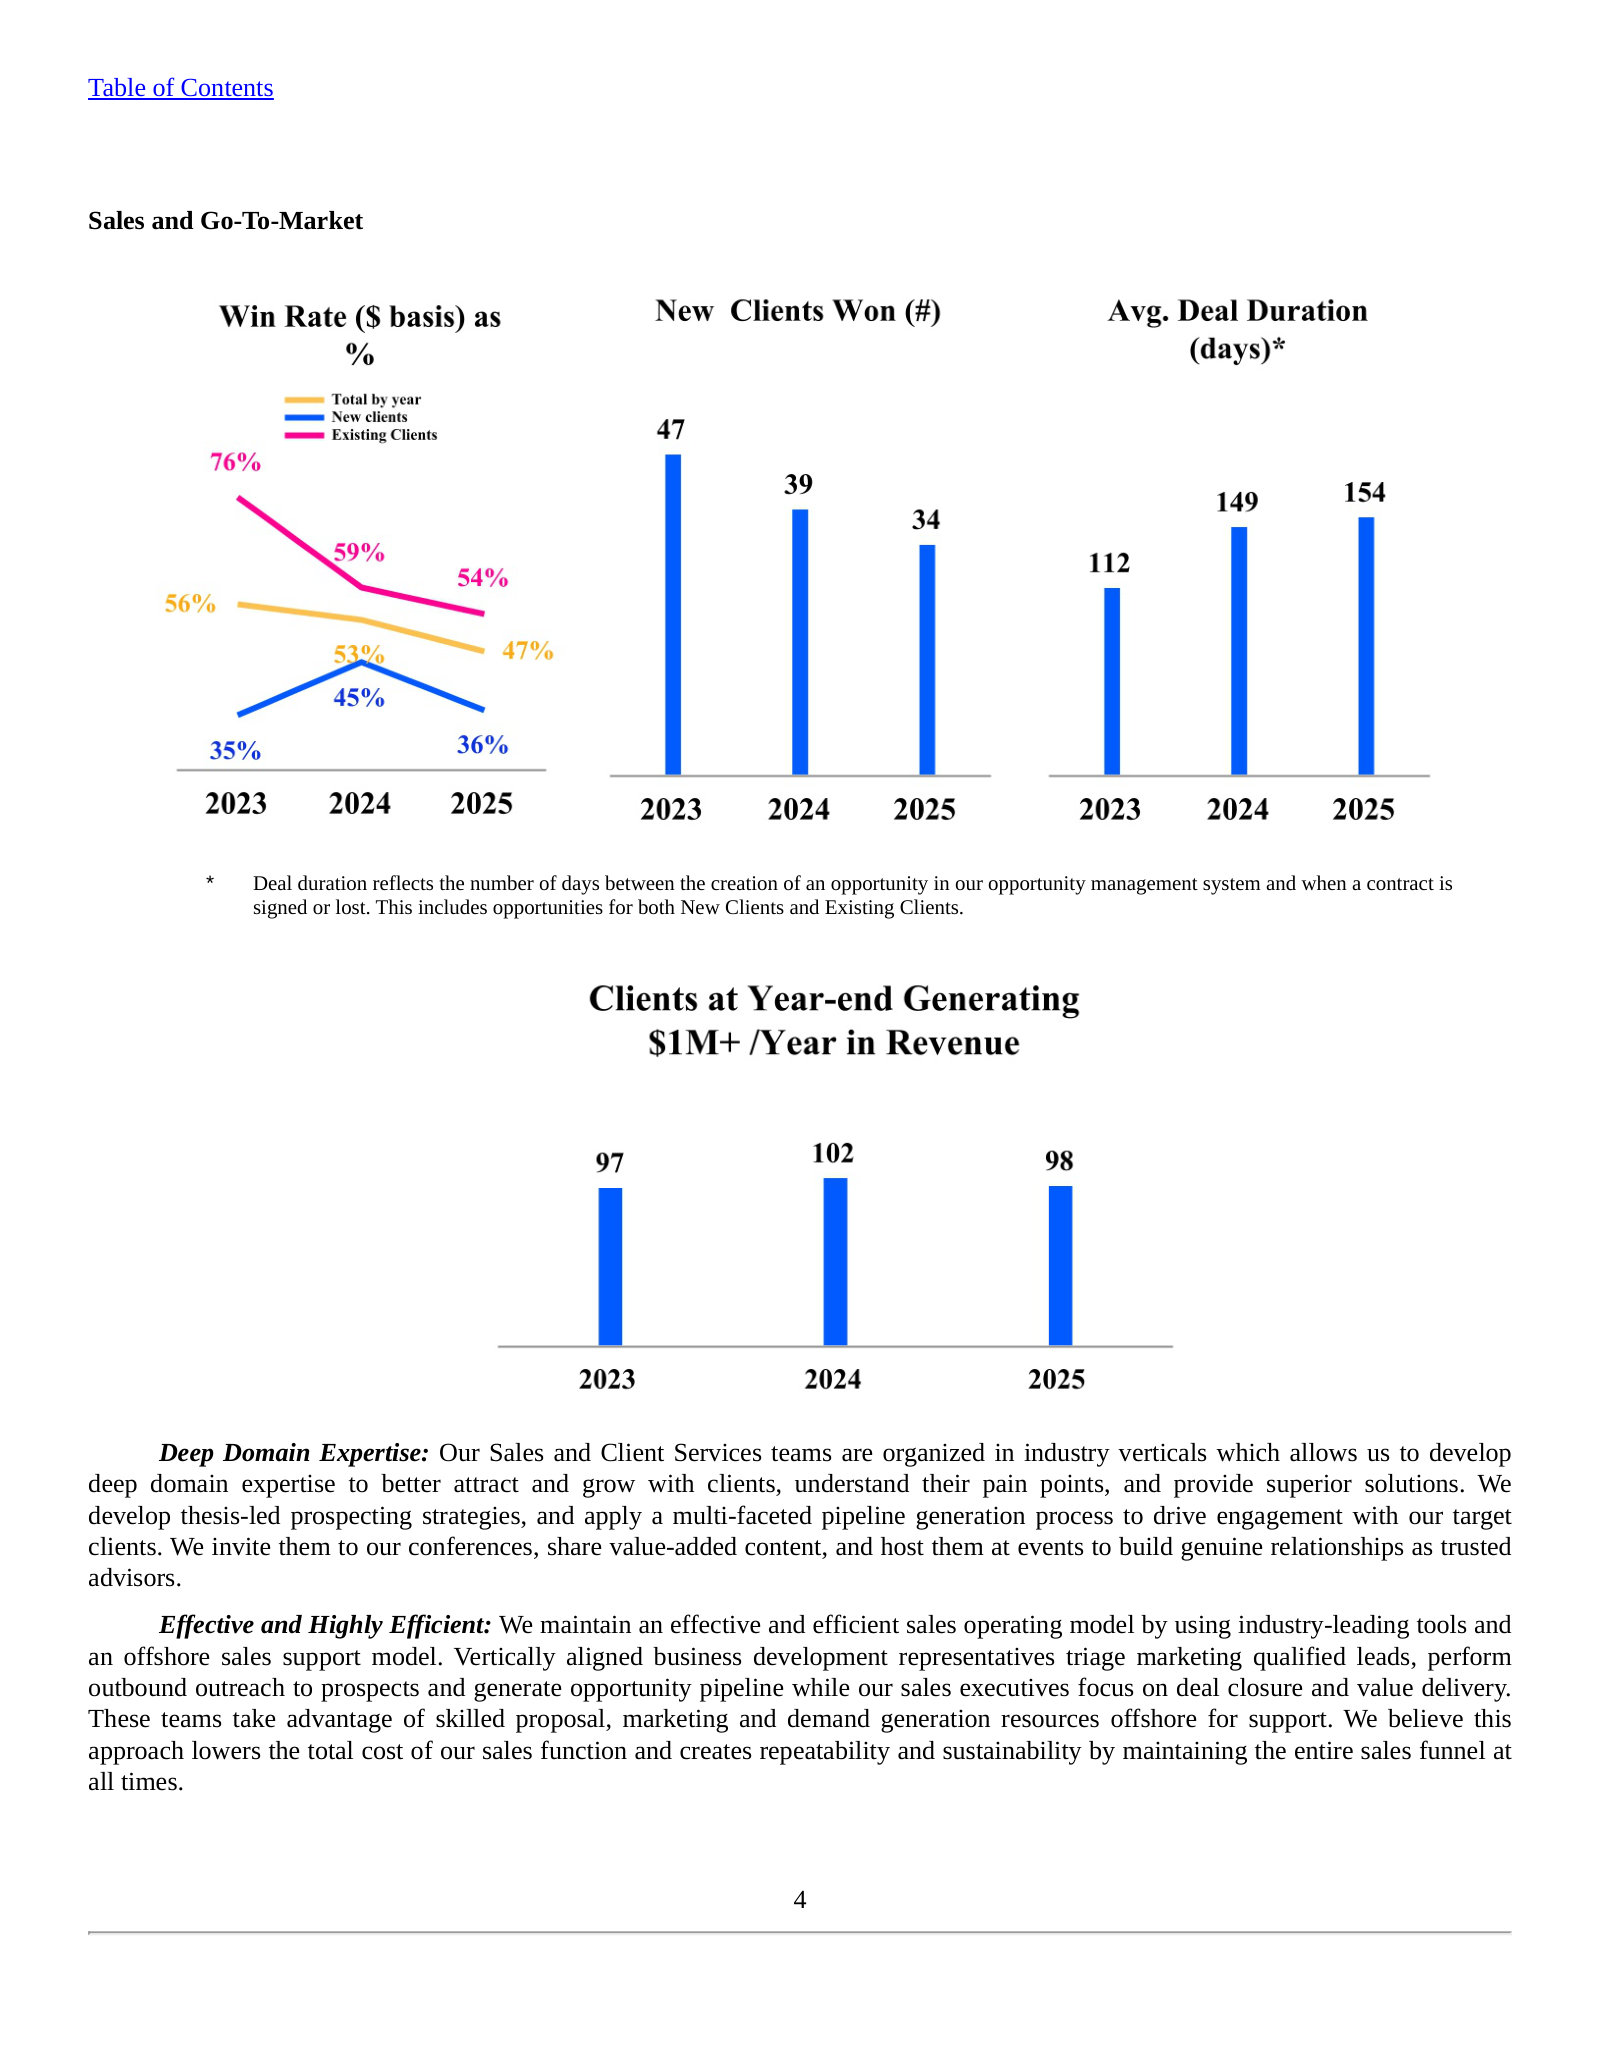
Human Capital and Global Delivery — p. 14 · Read the full section →
The cost model laid bare: an offshore, non-voice delivery base with 58% of ~65,500 staff in the Philippines.
Offshore/near-shore delivery: 87% non-voice revenue, Philippines is 58% of headcount, 31 sites in 13 countries.
Utilizing primarily offshore and near-shore markets is a central tenet of our service delivery strategy. Since 87% of our revenue in 2025 was delivered from non-voice, digital channels or omnichannel services, we are particularly well positioned to leverage an offshore/near-shore model. The Philippines is our largest off-shore market with approximately 38,100 people, or 58%, of Headcount of approximately 65,500 people worldwide. […] As of December 31, 2025, we operated across 31 locations in 13 countries in 2025.
p. 14 · Read in context →
Our Clients — p. 17 · Read the full section →
The single biggest fact in the filing: revenue is concentrated in a handful of clients, with Meta alone at 26%.
Client concentration: top 10 = 58% of revenue, top 20 = 71%, and Meta = 26%.
As of December 31, 2025, we supported approximately 200 clients, most of which are innovative companies in attractive, high growth industry verticals, including social media, e-commerce, gaming, streaming media, food delivery and ride sharing, technology, financial services, and healthcare. […] Our top 10 and top 20 clients accounted for 58% and 71% of our revenue for the fiscal year ended December 31, 2025, respectively. Our largest client, Meta, generated 26% of our revenue for the fiscal year ended December 31, 2025.
p. 17 · Read in context →
Item 1A. Risk Factors — Dependence on key clients — p. 22 · Read the full section →
Quantifies the concentration risk: losing any one of the top five (45% of revenue) or the top client (26%) would hurt materially.
Top five clients = 45% of revenue; the loss of a key client could materially harm results.
We derive a substantial portion of our revenue from a few key clients who generally retain us across multiple service offerings. Our top five clients accounted for 45% of our revenue for the fiscal year ended December 31, 2025. Our top client accounted for an aggregate of 26% of our revenue for the fiscal year ended December 31, 2025, across multiple service offerings. The reduction in revenue or loss of all or a portion of our business with, or the failure to retain a significant amount of business with, any of our key clients could have a material adverse effect on our business, financial condition or results of operations.
p. 22 · Read in context →
Item 1A. Risk Factors — AI could reduce demand for our services — p. 26 · Read the full section →
The existential question for a BPO stated plainly: the same Generative/Agentic AI it sells could shrink client spend.
Generative and Agentic AI could decrease demand for certain service offerings and reduce client spend.
Increased adoption and utilization of AI, including Generative AI and Agentic AI, by our clients and us, or our failure to appropriately incorporate Generative AI and Agentic AI into our operations, could adversely affect our business, reputation or financial results. […] As Generative AI and Agentic AI technologies continue to develop, demand for certain service offerings could decrease, further reducing our clients’ spend, which could have a negative impact on our revenue.
p. 26 · Read in context →
Item 1A. Risk Factors — Content moderation and employee well-being — p. 28 · Read the full section →
A liability unique to this business: moderators exposed to prohibited content, with unknown long-term mental-health effects.
Trust & Safety work may cause stress disorders and create liabilities, drawing press and regulatory scrutiny.
Trust & Safety, including content moderation and monitoring services, is a large and growing portion of our business. The longterm impacts on the mental health and well-being of our employees doing this work are unknown. This work may lead to stress disorders and may create liabilities for us. This work is also subject to significant press and regulatory scrutiny.
p. 28 · Read in context →
Item 1A. Risk Factors — Dependence on the Philippines and India — p. 32 · Read the full section →
Geographic concentration risk: 54% of revenue is delivered from the Philippines, exposed to typhoons and political instability.
54% of revenue delivered from the Philippines; disruption there or in India would adversely affect the business.
Our business is heavily dependent upon our international operations, particularly in the Philippines and India, and any disruption to those operations would adversely affect us. […] During the fiscal year ended December 31, 2025, we derived 54% of our revenue from work performed in the Philippines, 11% of our revenue from work performed in the United States and 13% of our revenue from work performed in India. The Philippines has experienced political instability, acts of natural disaster, such as typhoons and flooding, and the occasional health and security threat and continues to be at risk of similar and other events that may disrupt our operations.
p. 32 · Read in context →
Item 7. Management’s Discussion and Analysis — p. 74 · Read the full section →
Management explains the FY2025 result: 19% revenue growth to $1.18B, net income up 123%, and where each service line grew.
FY2025 results: net income +123% to $102.3M, Adjusted EBITDA +18.7% to $249.1M.
For the year ended December 31, 2025, we recorded net income of $102.3 million a 123.0% increase from $45.9 million for the year ended December 31, 2024, due primarily to higher revenue growth and the impact of foreign currency exchange rates, partially offset by higher cost of services. Adjusted Net Income for the year ended December 31, 2025 increased 27.8% to $151.7 million from $118.7 million for the year ended December 31, 2024. Adjusted EBITDA for the year ended December 31, 2025 increased 18.7% to $249.1 million from $209.9 million for the year ended December 31, 2024.
p. 76 · Read in context →
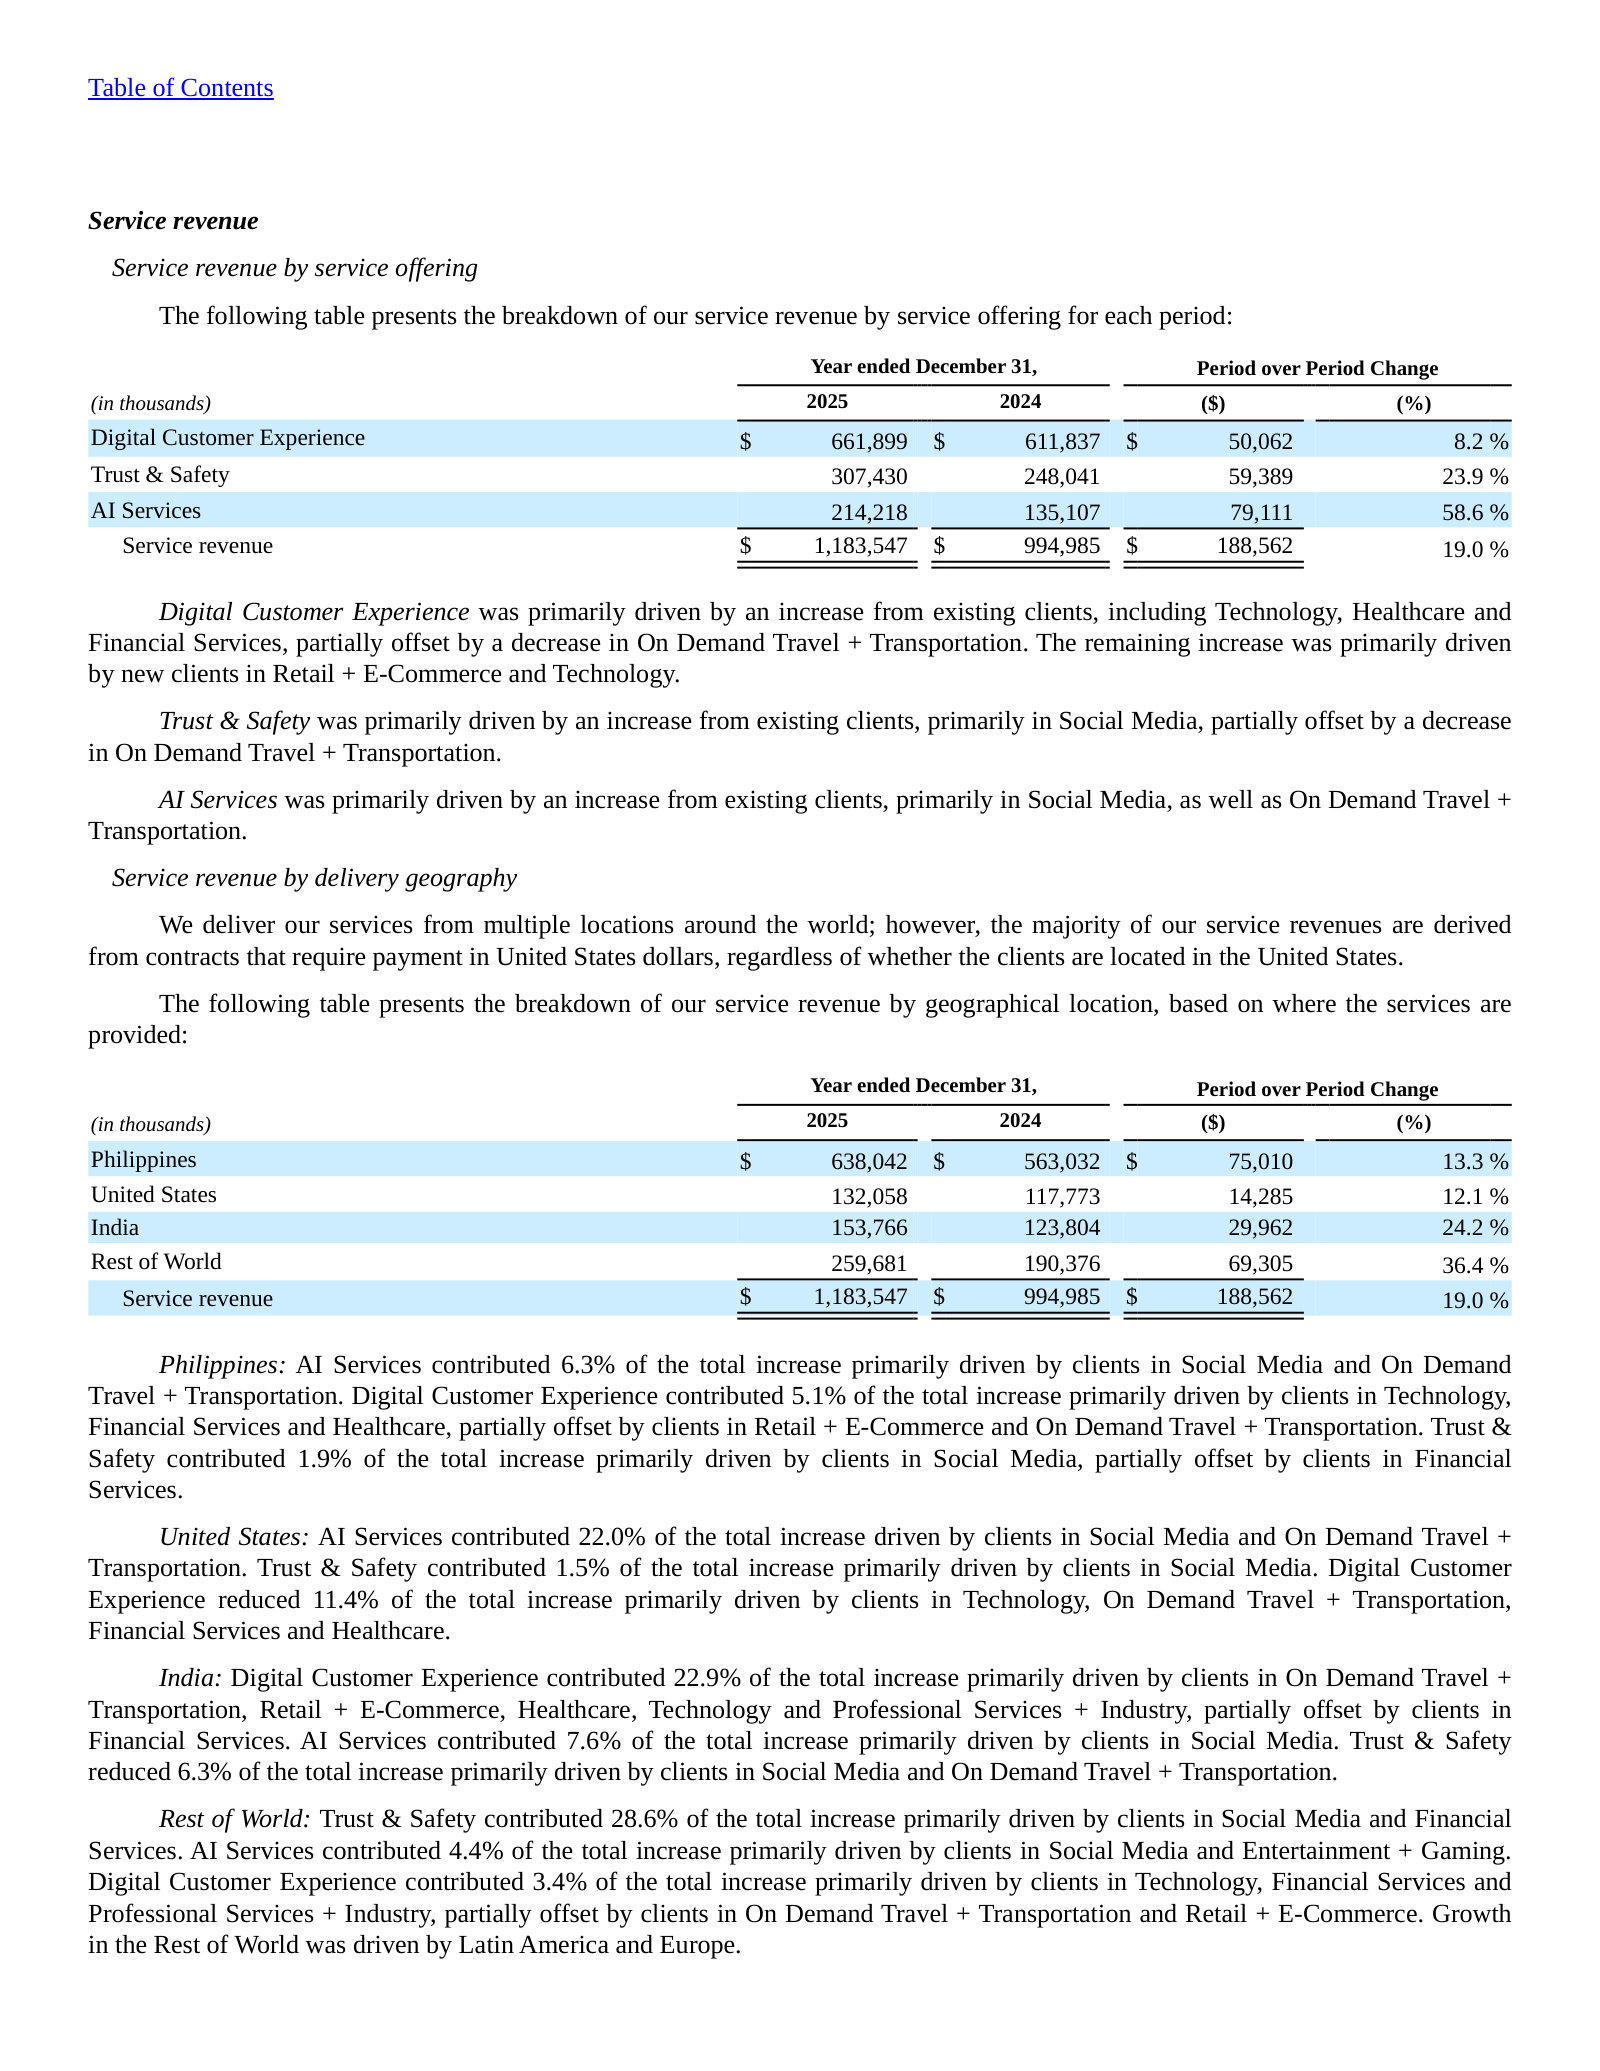
TaskUs, Inc. — FY2021 Annual Report (Form 10-K) — FY2021
First 10-K as a public company — included to show how the service lines were renamed and the business broadened by FY2025. · Open the full document →
Item 1. Business — Overview — p. 11 · Read the full section →
The original taxonomy: 'Content Security' and 'AI Operations' (now Trust & Safety and AI Services), serving 'over 100' tech clients.
FY2021 framing of the three service lines — before the Content Security → Trust & Safety rename.
Our global, omni-channel delivery model is focused on providing our clients three key services – Digital Customer Experience (“Digital CX”), Content Security and Artificial Intelligence (“AI”) Operations. Our Digital CX offerings serve the needs of the modern consumer, whose habits have changed in the past decade and revolve around the smartphone. Our Content Security offerings include content monitoring and moderation services, the need for which is increasingly critical to protect the sanctity of the open internet. Our AI Operations offerings include providing high quality, human-annotated data sets and algorithm training services to our clients as they navigate significant increases in the prevalence of disruptive AI technology.
p. 11 · Read in context →
More annual reports
TaskUs, Inc. — FY2024 Annual Report (Form 10-K) — FY2024 · 143 pages · Prior-year 10-K: the FY2024 baseline (revenue $995.0M) against which FY2025 growth is measured. · Open →
TaskUs, Inc. — FY2023 Annual Report (Form 10-K) — FY2023 · 108 pages · Captures the post-2022 growth slowdown and the emergence of AI Services as a distinct offering. · Open →
TaskUs, Inc. — FY2022 Annual Report (Form 10-K) — FY2022 · 109 pages · First full year after IPO; documents the transition from hyper-growth to a more measured trajectory. · Open →
Competitors describe TaskUs, Inc.'s market in their own filings and calls. These verified passages and visual pages show where their strategies meet, using source documents preserved in Sources.
Cognizant Technology Solutions Corporation (CTSH)
Cognizant is TaskUs's most direct large-scale competitor: its Intuitive Operations and Automation practice IS a business-process-outsourcing business whose named service lines — "omnichannel customer care" and "annotation services" — map one-for-one onto two of TaskUs's three segments (Digital Customer Experience and AI Operations/data labeling). Cognizant sizes that BPO business at roughly $3 billion of annualized revenue (multiples of TaskUs's ~$1 billion), is growing it high-single/low-double digits, and frames agentic AI as the engine to reshape it. Only the BPO/Intuitive-Operations and AI-data-services portions of Cognizant are in scope; its broader IT-services, consulting and engineering (Belcan) businesses are a separate, larger market. Exhibits are drawn from the FY2025 annual report and the FY2025 earnings calls; no Cognizant document names TaskUs.
Cognizant's annual-report description of its Intuitive Operations and Automation practice — its BPO business. The company lists the specific processes it runs for clients, including "omnichannel customer care" (TaskUs's Digital Customer Experience segment) and "annotation services" (TaskUs's AI Operations / data-labeling segment), all now infused with AI. This is the clearest single statement in the corpus of a large peer selling the same outsourced services TaskUs sells.
Our Intuitive Operations and Automation practice helps clients build and run modern operations through two main vehicles: AIled automation, which includes advisory and process and IT automation solutions designed to simplify and accelerate automation adoption, and business process outsourcing services, which help deliver business outcomes including revenue growth, increased customer and employee satisfaction and cost savings.[…]Our technology-driven business process outsourcing services incorporate key AI use cases to help clients transform and run functions and industry-specific processes such as finance and accounting, omnichannel customer care, loan origination, annotation services, location-based services and medical data management.
p. 16 · Read in context →
Cognizant's CEO sizes the BPO business at roughly $3 billion of annualized revenue and says it grew 10% over the prior two quarters — several times TaskUs's total revenue — and casts "agentification" and "digital labor" as what will reshape outsourced operations. Management's own framing; it captures both the scale gap versus TaskUs and the automation thesis that is central to the TaskUs investment debate.
Ravi Kumar S, Chief Executive Officer — prepared remarks (Q3 FY2025 earnings call): We believe much of Vector 3 will flow into intuitive operations and automation practice, which is our BPO business, including BPaaS services. Our BPO revenue grew 10% in the last 2 quarters and is on track to reach $3 billion in annualized revenue over the next several quarters. We believe agentification will unlock new labor pools, including roles that don't yet exist. As digital labor diffuses into enterprise operations, the nature of human endeavor will evolve.
p. 3 · Read in context →
Cognizant's CEO reports its "BPO business powered by deep immersion of digital labor grew 9%" for the quarter and the year, and flags its AI data training services — launched the prior year to help clients "build fine-tune AI models at speed and scale." That data-training/annotation offering targets the same AI-model-builder demand as TaskUs's AI Operations segment.
Ravi Kumar S, Chief Executive Officer — prepared remarks (Q4 FY2025 earnings call): Similarly, as our clients rethink their operations through an agentic lens, demand for our BPO business powered by deep immersion of digital labor grew 9% year over year in the quarter and the year. Our AI data training services launched early last year is gaining traction with our clients to build fine-tune AI models at speed and scale.
p. 2 · Read in context →
Accenture plc (ACN)
Accenture competes with TaskUs across all three of TaskUs's service lines. Its Operations business runs outsourced enterprise processes and explicitly lists "platform trust and safety" among them, and a risk factor confirms Accenture directly delivers "content moderation" — TaskUs's Trust & Safety segment — at a scale large enough to have drawn litigation and media coverage. Its Song practice and its agentic-AI push into contact-center reinvention collide with TaskUs's Digital Customer Experience segment. Only Accenture's Operations/Song/customer-service activities are in scope; its Strategy & Consulting, Technology and Industry X businesses are a far larger, adjacent market. No Accenture document names TaskUs.
Accenture's annual-report description of its Operations business: it runs enterprise processes on clients' behalf and names "platform trust and safety" among them — the same content-safety work that is TaskUs's Trust & Safety segment — delivered through its SynOps platform with generative AI embedded. Establishes Accenture as a same-service competitor in outsourced operations.
We operate business processes on behalf of clients for specific enterprise functions, including finance and accounting, sourcing and procurement, supply chain, marketing and sales, and human resources, as well as industry-specific services, such as platform trust and safety, banking, insurance, network and health services. We help organizations to reinvent themselves through intelligent operations, enabled by SynOps, our cloud enabled platform that empowers people with data, processes, automation, generative AI and a broad ecosystem of technology partners to transform enterprise operations at speed and scale.
p. 8 · Read in context →
A risk factor in Accenture's FY2025 10-K confirms it delivers "content moderation" for clients and acknowledges the reviewer-wellbeing exposure and litigation that attend it — the identical business, and the identical labor risk, that TaskUs flags for its own Trust & Safety segment. Read as Accenture's disclosure of a competing service, not a claim about relative scale.
In addition, we engage in platform trust and safety services on behalf of clients, including content moderation, which could have a negative impact on our employees due to the nature of the materials they review. We have been subject to media coverage regarding our provision of these services as well as litigation related to the provision of these services, which may result in adverse judgments or settlements or government inquiries and investigations.
p. 24 · Read in context →
Accenture's CEO describes reinventing clients' contact centers with agentic AI and a blended "digital agents and human agents" workforce — precisely the omnichannel customer-care market that is TaskUs's largest segment, framed here as an AI-led redesign of service delivery. It is both a competitive-strategy statement and a window on the gen-AI disruption TaskUs's Digital CX business faces.
Julie Sweet, Chair & Chief Executive Officer — prepared remarks (Q2 FY2026 earnings call): For example, in retail, service is no longer just about fixing problems; customers expect a consistent experience every time, even on a massive scale. We're working with retailers to reinvent contact centers and design the new processes with Agentic AI.[…]We aren't simply upgrading contact center technology; we're reimagining service at scale. The future workflow involves digital agents and human agents operating as one coordinated team to serve customers.[…]This simplifies work for employees, delivers faster and more personalized support for customers and creates a service engine designed to scale efficiently as the business grows.
p. 4 · Read in context →
International Business Machines Corporation (IBM) (IBM)
IBM's Consulting segment competes with TaskUs: its own 10-K defines that market as spanning "business process outsourcing services" and names the incumbent rivals (Accenture, Capgemini, India-based providers) TaskUs also faces. IBM Consulting's rapidly growing generative-AI book of business is being sold as help to "reengineer business processes" through "AI, automation and digital labor" — the automation-of-human-operations thesis that most directly bears on a labor-based BPO like TaskUs. Only IBM Consulting / business-process activity is in scope; IBM's Software (Red Hat, watsonx, mainframe transaction processing) and Infrastructure (IBM Z, storage) segments are separate markets and are excluded. No IBM document names TaskUs.
IBM's FY2025 10-K competition section defines its Consulting market as one that spans "business process outsourcing services" — the category TaskUs sells — and lists the same incumbent competitors (Accenture, Capgemini, India-based service providers) that populate TaskUs's competitive landscape. IBM's own description places it in TaskUs's addressable market.
Consulting integrates strategy, experience design, technology and operations expertise by domain across industries to deliver transformation for clients. Consulting operates in a highly competitive, dynamic market that spans business consulting, systems integration, application development and management, and business process outsourcing services. Our competitors include global firm such as Accenture, Capgemini, India-based service providers, management consulting firms, the consulting practices of public accounting firms, engineering service providers, and niche specialists.
p. 6 · Read in context →
IBM's CEO puts its cumulative generative-AI "book of business" at over $12.5 billion, of which consulting is more than $10.5 billion — the gen-AI services demand TaskUs's AI-adjacent offerings also chase, at a scale that dwarfs TaskUs's entire revenue base. Management's inception-to-date bookings figure, cited to show momentum, not a market-share measure.
Arvind Krishna, Chairman and Chief Executive Officer — prepared remarks (Q4 FY2025 earnings call): The breadth of our AI offerings is another key differentiator. Combining an innovative technology stack with consulting at scale, and our client zero journey. Our cumulative Gen AI book of business now stands at over $12.5 billion, of which software is more than $2 billion and consulting is more than $10.5 billion, with both seeing their largest quarterly increase to date.
p. 2 · Read in context →
IBM's CFO says generative AI was about half of Consulting signings and over 30% of backlog, with clients "turning to consulting to reengineer business processes and unlock productivity … through AI, automation and digital labor." This is IBM positioning gen-AI/agentic "digital labor" to reengineer the human-delivered business processes that are TaskUs's core revenue — the displacement risk stated from a rival's mouth.
James Kavanaugh, Senior Vice President and Chief Financial Officer — prepared remarks (Q2 FY2026 earnings call): In Consulting, signings grew 6%, marking our second consecutive quarter of growth and reflecting continued client investment in business transformation initiatives.[…]Generative AI represented about 50% of our signings in the quarter and now makes up over 30% of our backlog, underscoring the demand for AI-powered transformations that extend beyond technology modernization into core business operations. As clients move from pilots to enterprise-wide deployment, they are increasingly turning to consulting to reengineer business processes and unlock productivity and new business value through AI, automation and digital labor.
p. 3 · Read in context →
More peer documents
Q2_FY2025 — 13 pages · CEO (Q&A, p10-11) unveils "Cognizant AI Data Training Services" — a 10,000-person data/ML-training team pitched to Fortune 500 and Global 2000 companies "as they develop their AI models" — the most explicit head-to-head with TaskUs's AI Operations (data labeling/annotation) segment; also notes a large share of its BPO portfolio "supports digital natives," mirroring TaskUs's tech-client base. · Open →
CTSH_annual_report_FY2024 — 148 pages · The "Cognizant Moment" digital-experience practice (p17) describes reimagining "customer experiences" and pairing "GenAI's content generation capabilities alongside human ingenuity" — a CX/content collision with TaskUs's Digital CX and Trust & Safety lines. · Open →
Q1_FY2026 — 12 pages · CEO Julie Sweet (p2) quantifies Accenture's advanced-AI scale — approximately $11.5 billion in bookings across 11,000 projects and $4.8 billion in revenue — a market-sizing/leadership claim in the gen-AI services space TaskUs's AI Operations targets. · Open →
Q4_FY2025 — 13 pages · CEO (p1) reports Accenture tripled FY25 Gen AI revenue to $2.7 billion and nearly doubled Gen AI bookings to $5.9 billion off a $3 billion multi-year investment — the scale of the gen-AI reinvention wave reshaping the outsourced-services market TaskUs competes in. · Open →
Q3_FY2026 — 13 pages · CEO describes consolidating "fragmented operations across critical business functions into a unified managed services model with agentic AI embedded … humans in the lead" with "automation replacing manual effort" (p4) — the gen-AI-displaces-BPO-labor thesis central to the TaskUs debate. · Open →
Q3_FY2025 — 14 pages · CEO Krishna (p2-3) cites "over 200 consulting projects using digital workers at scale" and a consulting gen-AI book accelerating to over $1.5 billion in the quarter, plus a "hybrid model of people plus software" delivery approach that undercuts headcount-based BPO. · Open →
IBM_annual_report_FY2024 — 50 pages · The prior-year 10-K Consulting competition section (business overview) offers the FY2024 baseline of IBM's "business process outsourcing services" market definition and named rivals, useful for confirming the category framing is not a one-year artifact. · Open →
Source: S&P Capital IQ consensus via Xpressfeed · Generated 2026-08-03.
CapIQ consensus tape
S&P Capital IQ's consensus tape tells a two-part story. Brokers cut TaskUs's FY2027 forecasts hard early in 2026 — revenue toward $1,306M from about $1,401M, and normalized EPS from $1.73 to $1.52 — then let them settle. Reported quarters keep clearing the bar, with five straight normalized-EPS beats and every recent revenue print above consensus. The sell-side sits at hold, with price targets spanning $6 to $13.
The consensus tape at a glance
Revenue, FY2026E ($M)
EBITDA, FY2026E ($M)
EPS norm., FY2026E
Revenue, FY2027E ($M)
Source: derived from vendor data.
These are the current forward consensus levels, all in US dollars. FY2026 carries the deepest coverage on the tape; the forward years past it thin out quickly, so the numbers below matter more for their direction than their decimals.
A sharp FY2027 downgrade that has since settled
The clearest move in the tape is a downgrade to FY2027 that landed early in 2026. Revenue consensus for FY2027 fell from roughly $1,401M six months ago to $1,306M now, and normalized EPS from $1.73 to $1.52 — most of the cut arriving before spring, with little change since. That both the top line and EPS were marked down together reads as a genuine reset of the forecast, not a margin story. FY2028, by contrast, has barely moved.
Source: derived from vendor data.
Revenue growth accelerates while margins wobble
Consensus has revenue climbing from about $1,174M in FY2025 to roughly $1,585M by FY2029, with growth stepping up from the mid-single digits toward low-double digits. EBITDA is the more uneven line: the street sees it slipping from about $248M in FY2025 to $232M in FY2026 before recovering to $357M by FY2029 — a visible margin trough in the near year even as revenue keeps rising.
Source: derived from vendor data.
The far right of this chart leans on very few analysts — treat the FY2029 step-up as one contributor's view, discussed below.
Reported quarters keep clearing the bar
Across the last eight reported quarters, revenue cleared consensus every time and normalized EPS missed only once, in FY2024 Q4. The EPS beats run large — often double-digit, peaking near 28% in FY2025 Q2 — against far milder revenue surprises of 2% to 8%. A record of small revenue beats paired with big EPS beats is the signature of conservative earnings guidance rather than a demand surprise.
Source: derived from vendor data.
Disagreement widens in the outer years
Disagreement is modest in the near years and widens further out. On EBITDA, the FY2026 range is tight around $232M, but by FY2028 estimates span roughly $260M to $313M on just five contributors — the wider bars on the right are as much about thinning coverage as about genuine debate.
Source: derived from vendor data.
The street sits at hold
The sell-side is committed but not bullish: two buy ratings, five holds and one sell, a consensus that reads as hold. Price targets are widely spread — from $6 to $13 around a $9.50 mean — a low-to-high range of more than double, which is itself a signal of unsettled views on where this business lands.
Target, mean
Target, high
Target, low
Consensus score
Source: derived from vendor data.
The consensus score sits between buy and hold on the standard sell-side scale, closer to hold. Visible Alpha's tab carries the driver-level broker models behind these headline figures.
Visible Alpha broker models via S&P Xpressfeed · 6 brokers · 317 line items · freshest revision 2026-06-24.
Broker Models
Broker models frame TaskUs as a business with a slow-growing legacy core and one accelerating engine. Digital customer experience — still the majority of revenue — is modeled almost flat, slipping from 58% to 51% of the mix. AI operations does the work: from roughly $203M and 17% of revenue in FY2025 to about $358M and 26% by FY2028. That single line is also where broker estimates diverge most, so the model debate is really a debate about the AI ramp.
AI operations is the modeled growth engine
FY2028 Revenue
FY2028 AI Operations Revenue
FY2028 AI Operations Mix
FY2028 EBITDA
Source: derived from vendor data.
Total revenue is modeled to compound at a mid-single-digit rate — about $1.17B in FY2025 to $1.41B in FY2028 — but the composition is what matters. AI operations nearly doubles over the horizon while the two larger lines barely move. Digital customer experience adds only about $31M across three years, and Content security is essentially flat near $290M to $318M.
Source: derived from vendor data.
Legacy Digital customer experience slips below half the mix
The mix shift is the cleanest way to read the model. Digital customer experience — the traditional support and delivery business — falls from about 58% of revenue to 51% over the horizon, crossing below half by FY2028. AI operations picks up the ceded share, rising from 17% to 26%; Content security drifts down slightly. This is a re-weighting, not a decline: DCX dollars still grow, just slower than the company overall.
Source: derived from vendor data.
Where brokers disagree: the AI ramp
The AI operations line is thin on coverage and wide on outcome. Through FY2028 it rests on only three to four brokers, and the spread balloons over time: FY2025 estimates sit in a tight $191M to $216M band, but by FY2028 they run from $260M to $409M — a range wider than the entire Content security segment. The bull-versus-bear case for TaskUs is largely a single question: how fast AI operations scales.
Source: derived from vendor data.
The profit path dips in FY2026 before recovering
EBITDA is modeled roughly flat-to-up, reaching about $240M by FY2028, but net income and EPS take a visible detour first. Diluted EPS is modeled to fall from about $0.99 in FY2025 to $0.90 in FY2026, then recover to $1.14 by FY2028; net income traces the same trough, dipping from roughly $93M to $83M before rebuilding. Operating income holds steady through the dip, so the FY2026 soft patch sits below the operating line rather than in the core business.
Source: derived from vendor data.
Source: derived from vendor data.
Cash conversion holds through the dip
Free cash flow keeps climbing even where earnings wobble: brokers model FCF from about $99M in FY2025 to $138M in FY2028, tracking operating cash flow of roughly $159M to $206M. The gap between the two is modest and stable — capital intensity in this delivery model is low — so the FY2026 earnings dip does not show up in cash.
Source: derived from vendor data.
Geography: the United States is the fastest-growing delivery line
On the two brokers that split revenue by geography, the Philippines remains the delivery hub at roughly $643M to $705M, but the United States line grows fastest — about $130M to $171M from FY2025 to FY2027, consistent with onshore and nearshore demand. India grows steadily; Rest of World is flat. This cut is the thinnest in the feed, so read it as directional.
Source: derived from vendor data.
Headline P&L consensus, momentum and beat/miss live in the CapIQ tab.
Source: S&P Capital IQ transcripts via Xpressfeed · latest indexed call 2026-05-06 · generated 2026-08-03.
Latest call digest
TaskUs, Inc., Q1 2026 Earnings Call, May 06, 2026 · 2026-05-06T21:00:00
The Q1 2026 call (May 6, 2026) paired a clean beat with a more cautious forward tone. Management led with $306.3 million in revenue, up 10.3% year over year, and a 19.1% adjusted EBITDA margin ($58.6 million), alongside a completed refinancing and a $3.65 per share special dividend. Prepared remarks reiterated the full-year revenue range of $1.21 billion to $1.24 billion and raised the adjusted free cash flow outlook to $110 million at the midpoint. The Q&A focused on the softer signals underneath: the largest client (24% of revenue) is expected to keep shrinking on automation before vendor consolidation helps, Trust and Safety is now guided to decline year over year starting in Q2, and Q2 revenue is guided down sequentially to $296 million to $298 million at roughly 18% margin. Against that, management leaned on AI Services (up 36%, a sixth straight quarter above 30%) and said autonomous-vehicle and robotics revenue should more than triple in 2026. Analysts pressed hardest on the pace of the largest-client decline and the confidence behind the implied second-half ramp.
Participant coverage from the latest call.
| Group | Participants | Count |
|---|---|---|
| Management | Operator; Trent Thrash — Senior VP of Corporate Development, Treasury & Interim Head of Investor Relations, TaskUs, Inc.; Bryce Maddock — Co-Founder, CEO & Chairman, TaskUs, Inc. | 3 |
| Analysts | Puneet Jain — Computer Services and IT Consulting Analyst, JPMorgan Chase & Co, Research Division; Yu Lee — MD of Equity Research & Senior Equity Analyst, Guggenheim Securities, LLC, Research Division; Jacob Haggarty — Research Analyst, Robert W. Baird & Co. Incorporated, Research Division; Matt Dezort — Research Analyst, William Blair & Company L.L.C., Research Division | 4 |
Curated latest-call exchanges; one row per analyst topic.
| Analyst | Firm | Topic | What changed in Q&A |
|---|---|---|---|
| Puneet Jain | JPMorgan | AI consulting economics and AI Services scalability | Asked about the margin/revenue profile of AI consulting sold into existing DCX clients and whether AI Services can double operationally; management pointed to reseller markups now and a move toward outcome-based per-resolution pricing. |
| Jonathan Lee | Guggenheim Securities | Largest-client decline pace and a stabilization floor | Pressed on whether the largest client's contraction is tracking to plan or accelerating and where spend might stabilize; management said guidance keeps automation in line with the client's latest input and did not quantify a floor. |
| Jonathan Lee | Guggenheim Securities | Confidence in the implied back-half ramp | Questioned what underpins the sequential step-up implied by the reiterated full-year guide; management cited ramp plans with existing clients, largely in AI Services. |
| Jacob Haggarty | Robert W. Baird | Onshore AI Services and automation spreading in Trust and Safety | Asked whether onshore AI Services work can later shift offshore for margin, and whether other Trust and Safety clients are automating like the largest client; management expects some offshoring over time and confirmed broader Trust and Safety softness. |
| Matt Dezort | William Blair | AV/robotics growth and macro | Asked about the raised AV/robotics outlook (triple versus the prior doubling) and macro/operational impacts; management framed AV as further along than robotics and reported no material demand hit from macro. |
Theme tracker
Themes are curator-classified across supplied calls.
| Theme | Status | Quarters mentioned | Read-through |
|---|---|---|---|
| AI Services as the fastest-growing service line | persisted | Q2 2024, Q3 2024, Q4 2024, Q3 2025, Q4 2025, Q1 2026 | Moved from a year-over-year decline in early 2024 to 60%+ growth by Q3 2025, moderating to 36% in Q1 2026 while remaining the top grower; management repeatedly flags its project-based lumpiness. |
| Largest-client concentration and trajectory | persisted | Q2 2024, Q3 2024, Q4 2024, Q3 2025, Q4 2025, Q1 2026 | Reframed over the window from the primary growth engine (up 41% in 2025) to an automation-driven headwind expected to weigh on 2026, with vendor consolidation cited as the medium-term offset. |
| AI transformation and agentic AI consulting pivot | emerged | Q4 2024, Q3 2025, Q4 2025, Q1 2026 | First announced as a formal pillar in Q4 2024 and steadily deepened, including partnerships with Decagon and Regal and a stated intent to sell technology-plus-talent at a single price per contact. |
| Near-term margin pressure from growth and AI investment | persisted | Q2 2024, Q3 2024, Q4 2024, Q3 2025, Q4 2025, Q1 2026 | Recurring driver behind softer margins: first ramp/facility costs and pricing pressure in 2024, then geo mix shift to onshore AI Services and AI-transformation spend into 2026. |
| Crypto and equity-trading client exposure callouts | dropped | Q2 2024, Q3 2024, Q4 2024 | Management routinely sized this cohort at roughly 4-5% of revenue through 2024, then stopped calling it out in the 2025-2026 calls reviewed. |
Guidance ledger
Quotes, calls, and speakers are source-verified; outcomes are curator-classified.
| Verbatim guidance | Call | Speaker | Curator outcome | Outcome note |
|---|---|---|---|---|
| “We expect to deliver full year 2025 revenue of approximately $1.11 billion at the midpoint of our guidance range of $1.095 billion to $1.125 billion.” | TaskUs, Inc., Q4 2024 Earnings Call, Feb 26, 2025 · 2025-02-26T22:00:00 | Bryce Maddock | kept | Full-year 2025 revenue finished at $1.184 billion, above the top end of this range, per the Q4 2025 call. |
| “We expect to generate adjusted free cash flow of approximately $100 million for the year.” | TaskUs, Inc., Q3 2025 Earnings Call, Nov 07, 2025 · 2025-11-07T13:00:00 | Balaji Sekar | missed | Full-year 2025 adjusted free cash flow came in at $89.9 million, below the roughly $100 million target, on working-capital growth. |
| “We expect 2026 revenue to approximate $1.21 billion to $1.24 billion, reflecting approximately 3.5% growth at the $1.225 billion midpoint of our guidance range.” | TaskUs, Inc., Q4 2025 Earnings Call, Feb 25, 2026 · 2026-02-25T22:00:00 | Bryce Maddock | pending | Reiterated at the Q1 2026 call after a first-quarter revenue beat. |
| “we expect that our top 20 clients outside of our largest client will see revenue grow by approximately 15% in 2026” | TaskUs, Inc., Q4 2025 Earnings Call, Feb 25, 2026 · 2026-02-25T22:00:00 | Bryce Maddock | pending | The Q1 2026 call reported clients 2 through 20 growing over 20%, tracking ahead of this early in the year. |
| “We're increasing our outlook for adjusted free cash flow by approximately 10% to $110 million at the midpoint with a range of $105 million to $115 million.” | TaskUs, Inc., Q1 2026 Earnings Call, May 06, 2026 · 2026-05-06T21:00:00 | Bryce Maddock | pending | Raised from the roughly $100 million 2026 target set at the Q4 2025 call; full-year result not yet reported. |
Q&A pressure map
Question counts and firms are curator tallies; analyst coverage shown above.
| Topic | Questions | Firms | Pressure / response |
|---|---|---|---|
| Largest-client durability and automation risk | 9 | Guggenheim Securities, JPMorgan, Morgan Stanley, William Blair | The single most persistent line of questioning across the window. Management consistently reaffirmed the relationship and the vendor-consolidation thesis, but when asked in Q1 2026 to size a stabilization floor for the client's spend it declined to give a number, holding to the client's latest automation guidance. |
| Margins and the growth/AI investment trade-off | 8 | Goldman Sachs, Robert W. Baird, Morgan Stanley, William Blair | Analysts repeatedly probed the drivers and durability of margin compression. Management pointed to ramp costs and geo/pricing mix in 2024 and to onshore AI Services mix plus AI-transformation spend in 2025-2026, framing lower margins as a deliberate trade for long-term growth. |
| AI Services sustainability and scale | 6 | William Blair, JPMorgan, Robert W. Baird, Goldman Sachs | Recurring questions on whether the high growth is durable given its project-based nature. Management acknowledged lumpiness while maintaining it can remain the fastest-growing line and could double. |
Language shifts
Only language evidence verified against the referenced component is shown.
| Observation | Verbatim evidence | Call ID | Component |
|---|---|---|---|
| The largest client shifted in management's language from the top growth engine to an explicit automation headwind versus the confident growth framing of 2024. | “we continue to expect revenue to be negatively impacted by their automation efforts throughout 2026 before seeing the benefit of vendor consolidation in the medium-term” | 1996102081 | 2 |
| A first explicit call for Trust and Safety to decline, after that line posted roughly 18-31% growth through 2024-2025 and an eighth straight quarter near 20% was noted in Q3 2025. | “we expect our Trust and Safety revenues to decline year-over-year starting in Q2 and for the full year of 2026” | 1996102081 | 2 |
| New hedging vocabulary accompanied the Q3 2025 AI-transformation pivot, a departure from the margin-expansion emphasis of the 2024 calls. | “This journey will not be a straight line. Our increased investment will reduce our margins in the near term.” | 1967919678 | 2 |
| Confidence in the physical-AI opportunity stepped up between calls, with the AV/robotics outlook raised from the Q4 2025 doubling framing. | “we believe revenue from clients in this space will more than triple in 2026” | 1996102081 | 2 |
The call history reframes the debate: a 2024 growth reacceleration led by the largest client has given way to a 2025-2026 transition in which that client and Trust and Safety turn from tailwinds into headwinds, leaving the bull case resting on AI Services (especially AV and robotics) and an as-yet-unproven move to outcome-based pricing.