TaskUs, Inc.'s management explains the business in its own materials. The slides below do the most of that work, pulled from the documents preserved in Sources. Each source link opens the complete presentation at that slide in a new tab.
Management's current company overview: what TaskUs does, its three service lines, geography, its strategy for the AI era, and the numbers. · Open the full document →
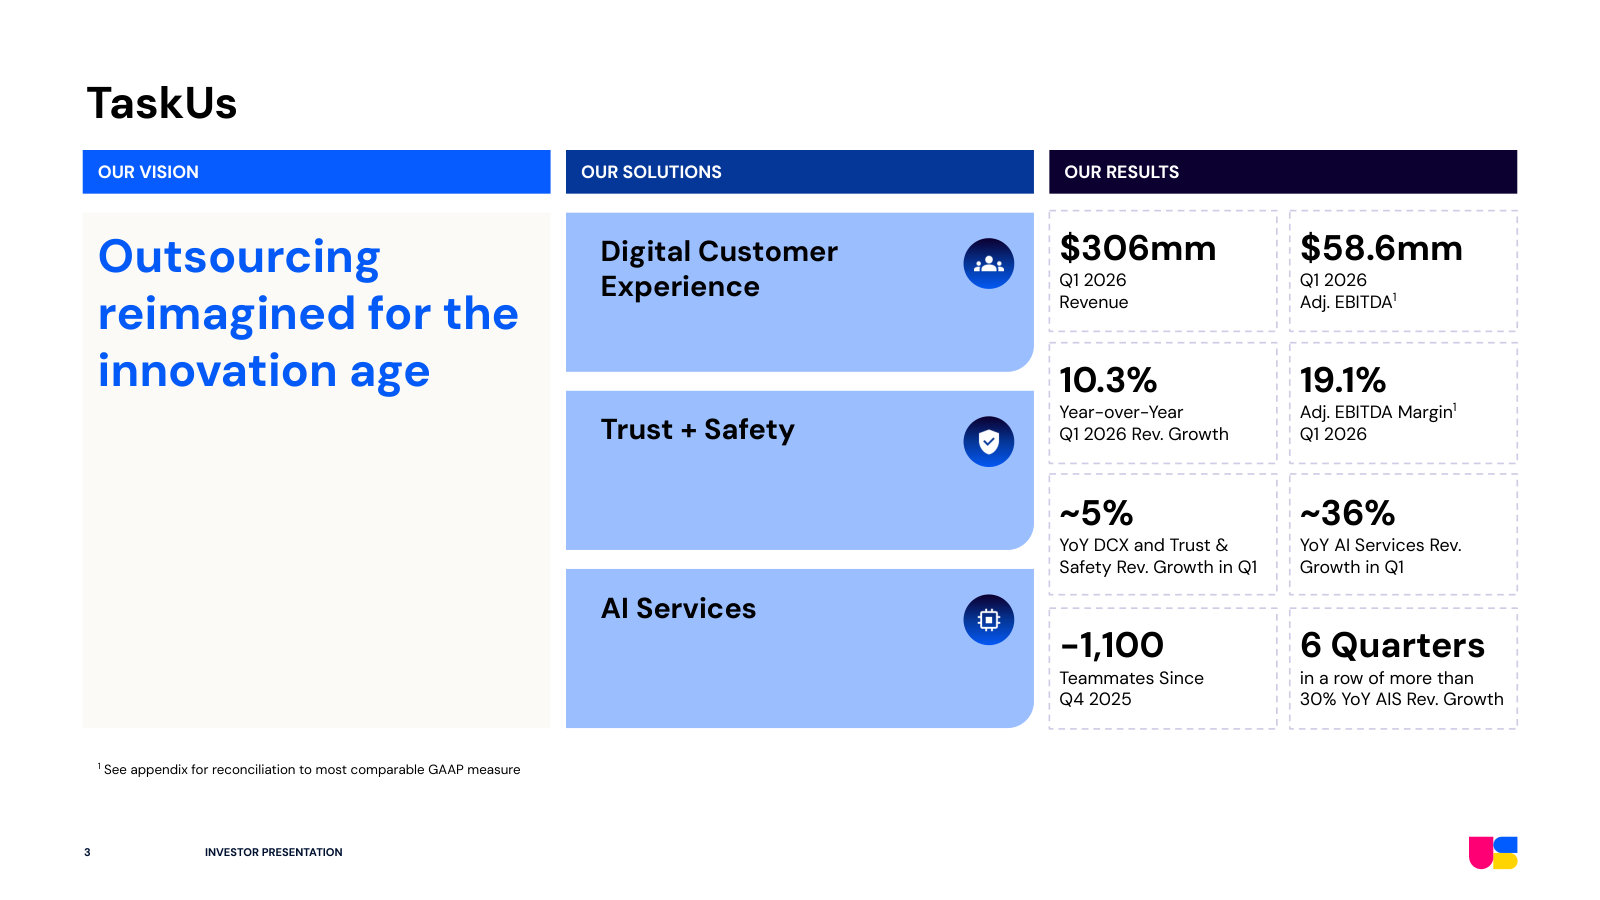
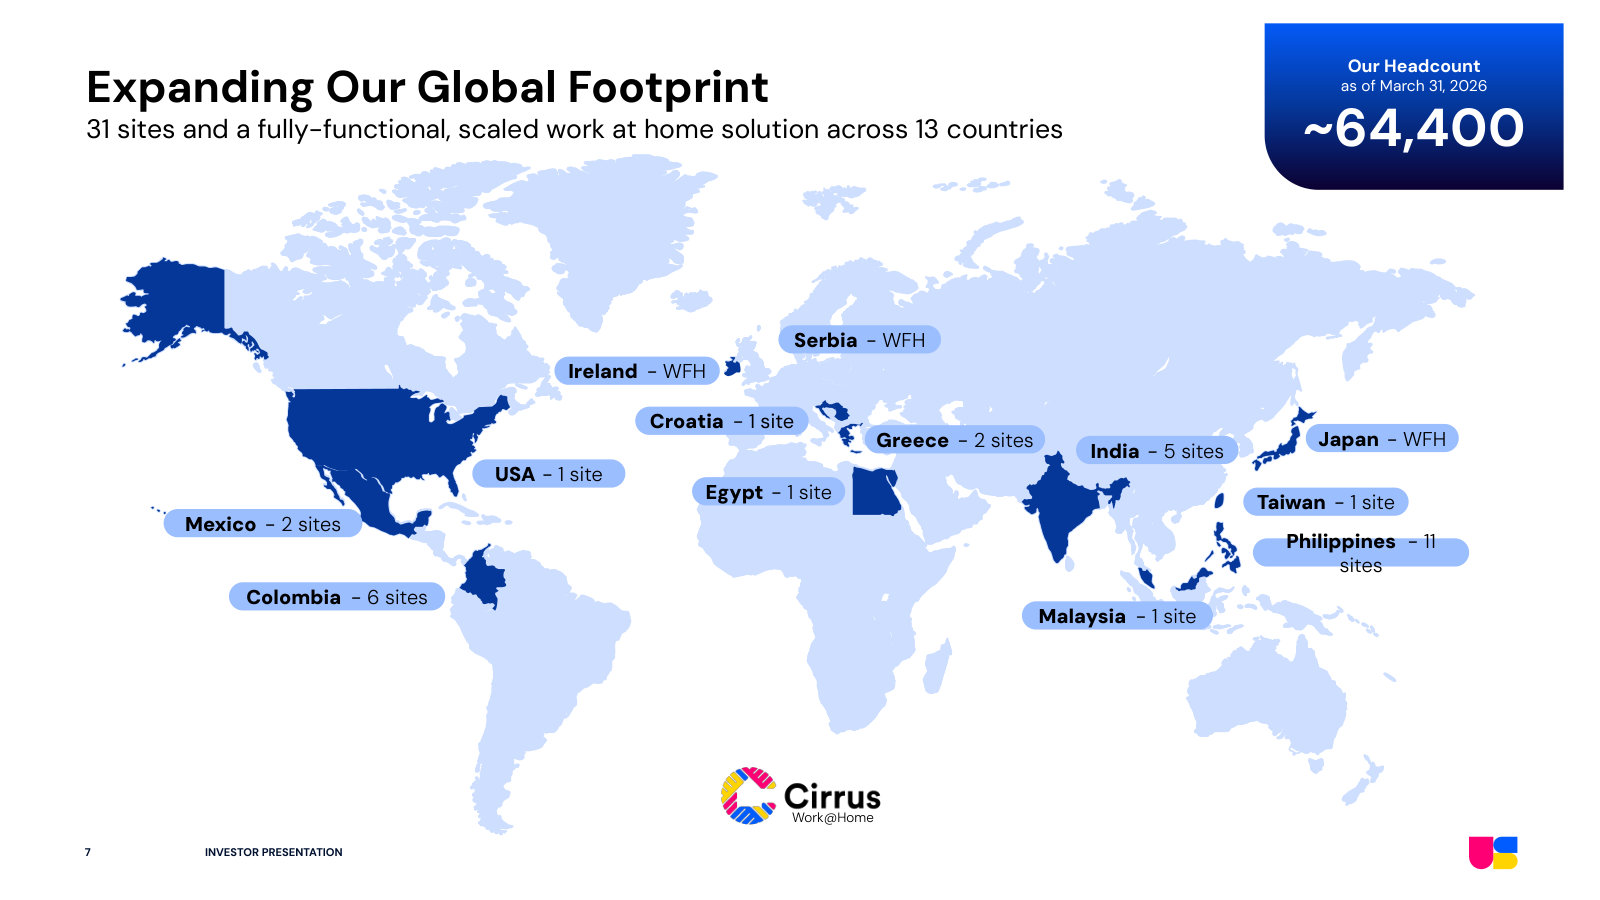
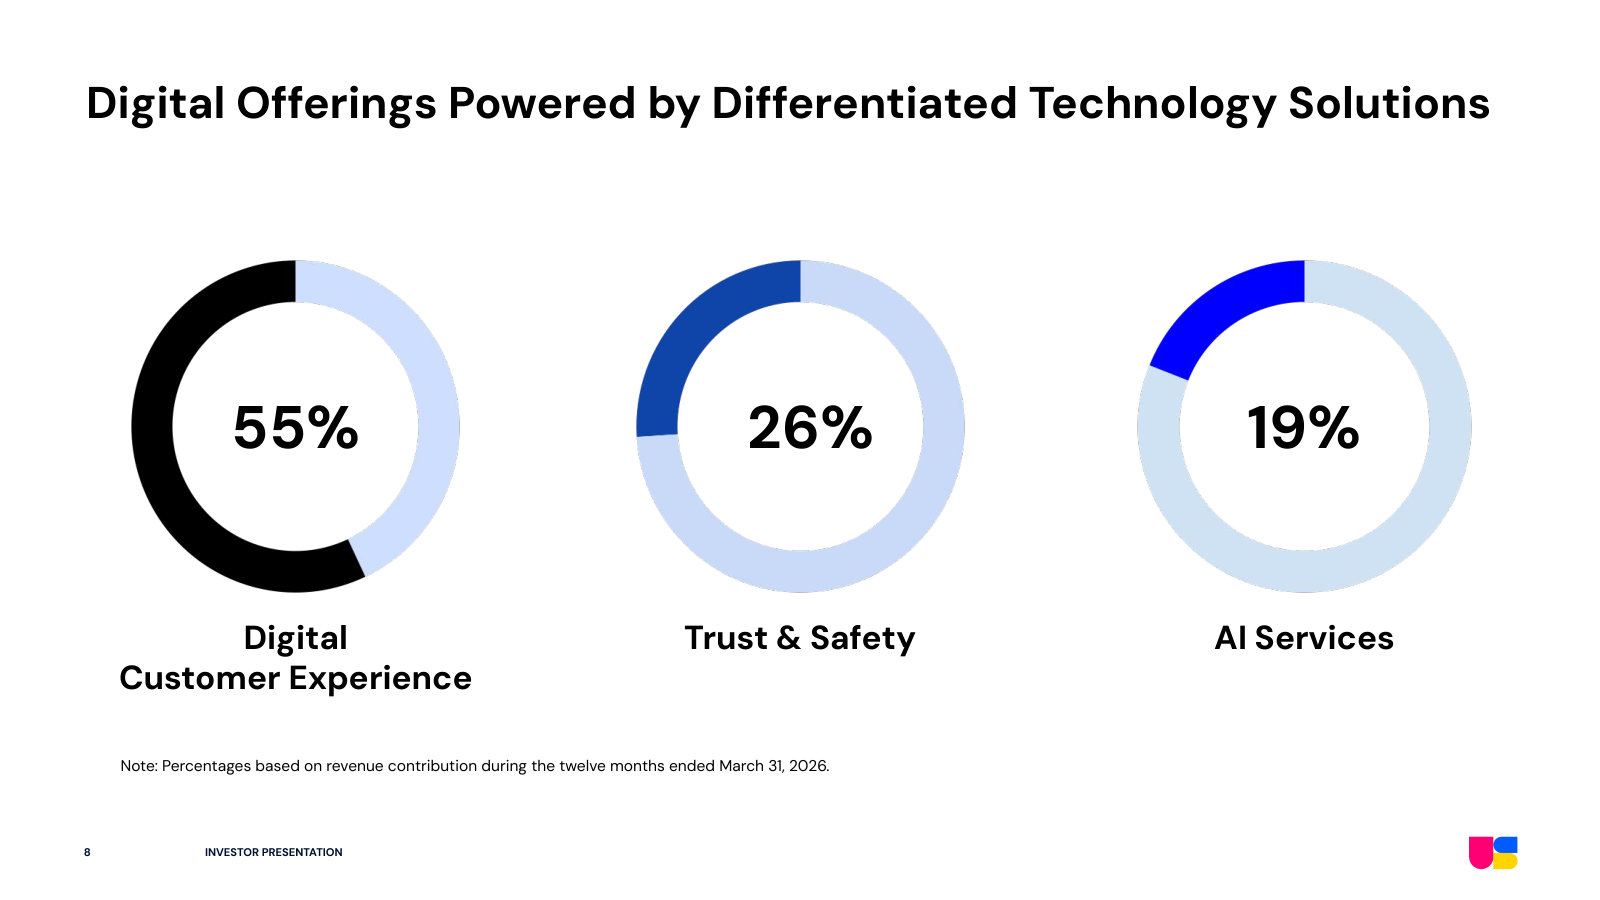
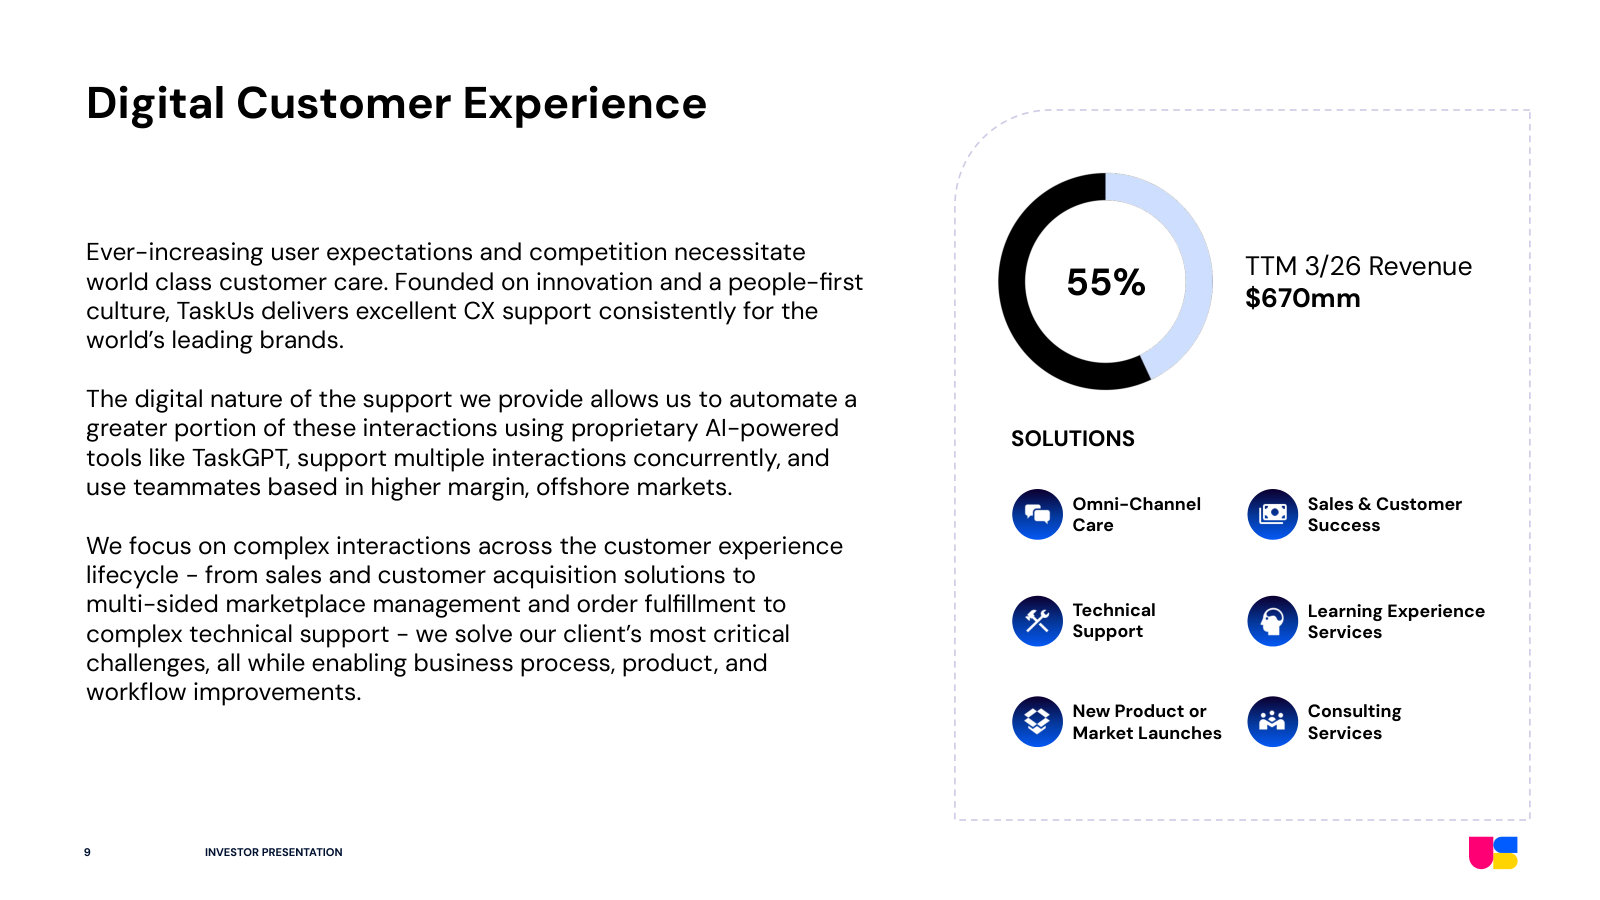
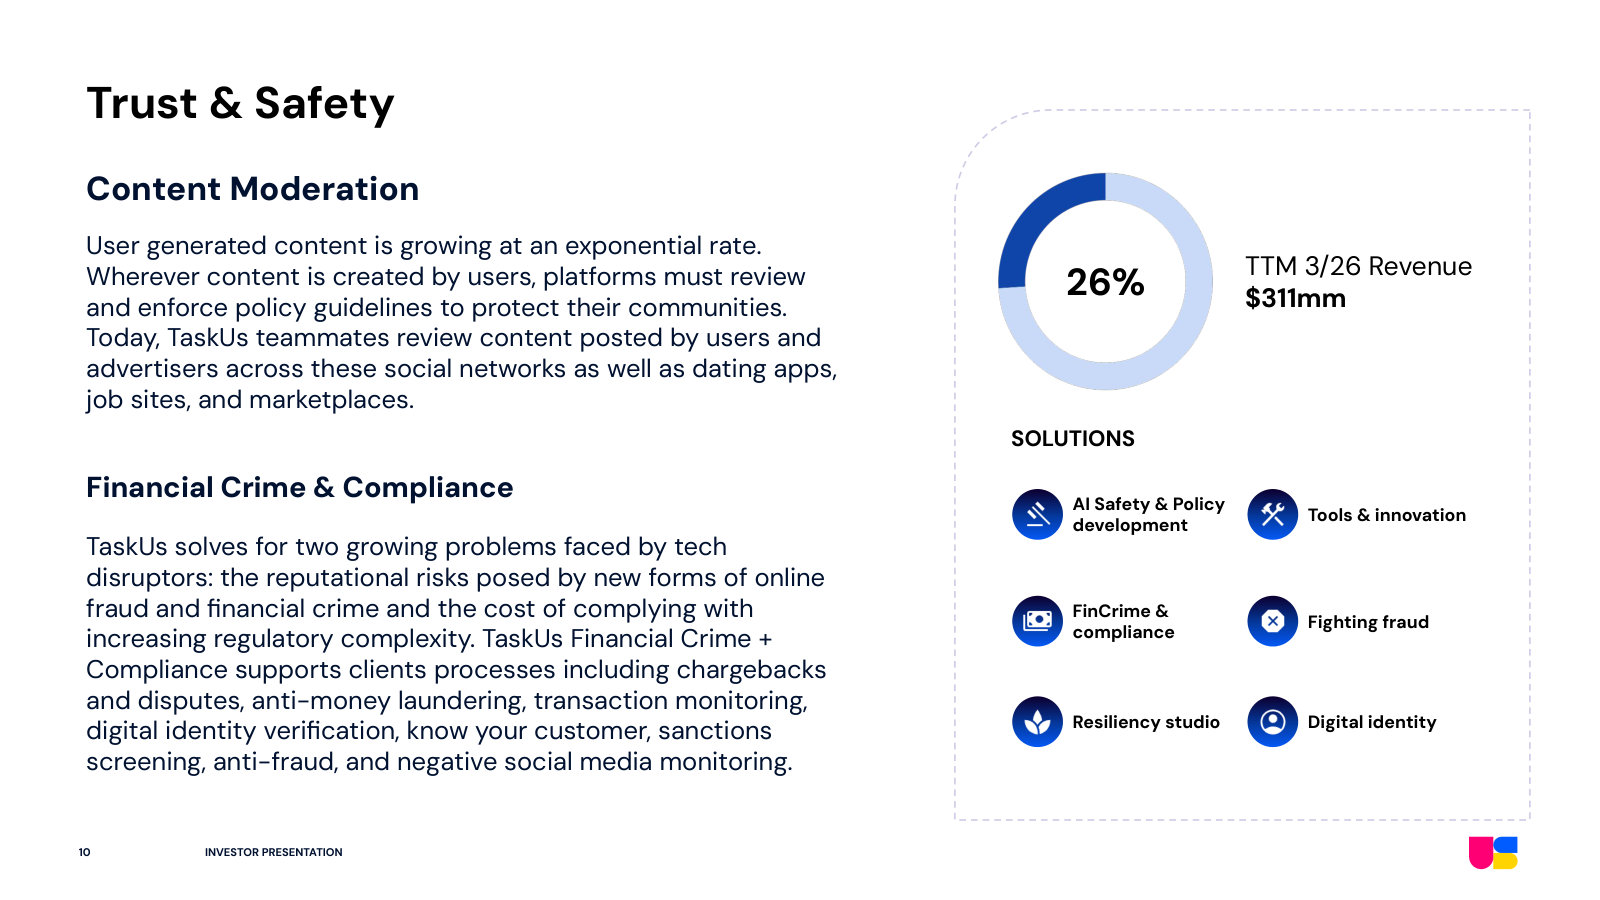
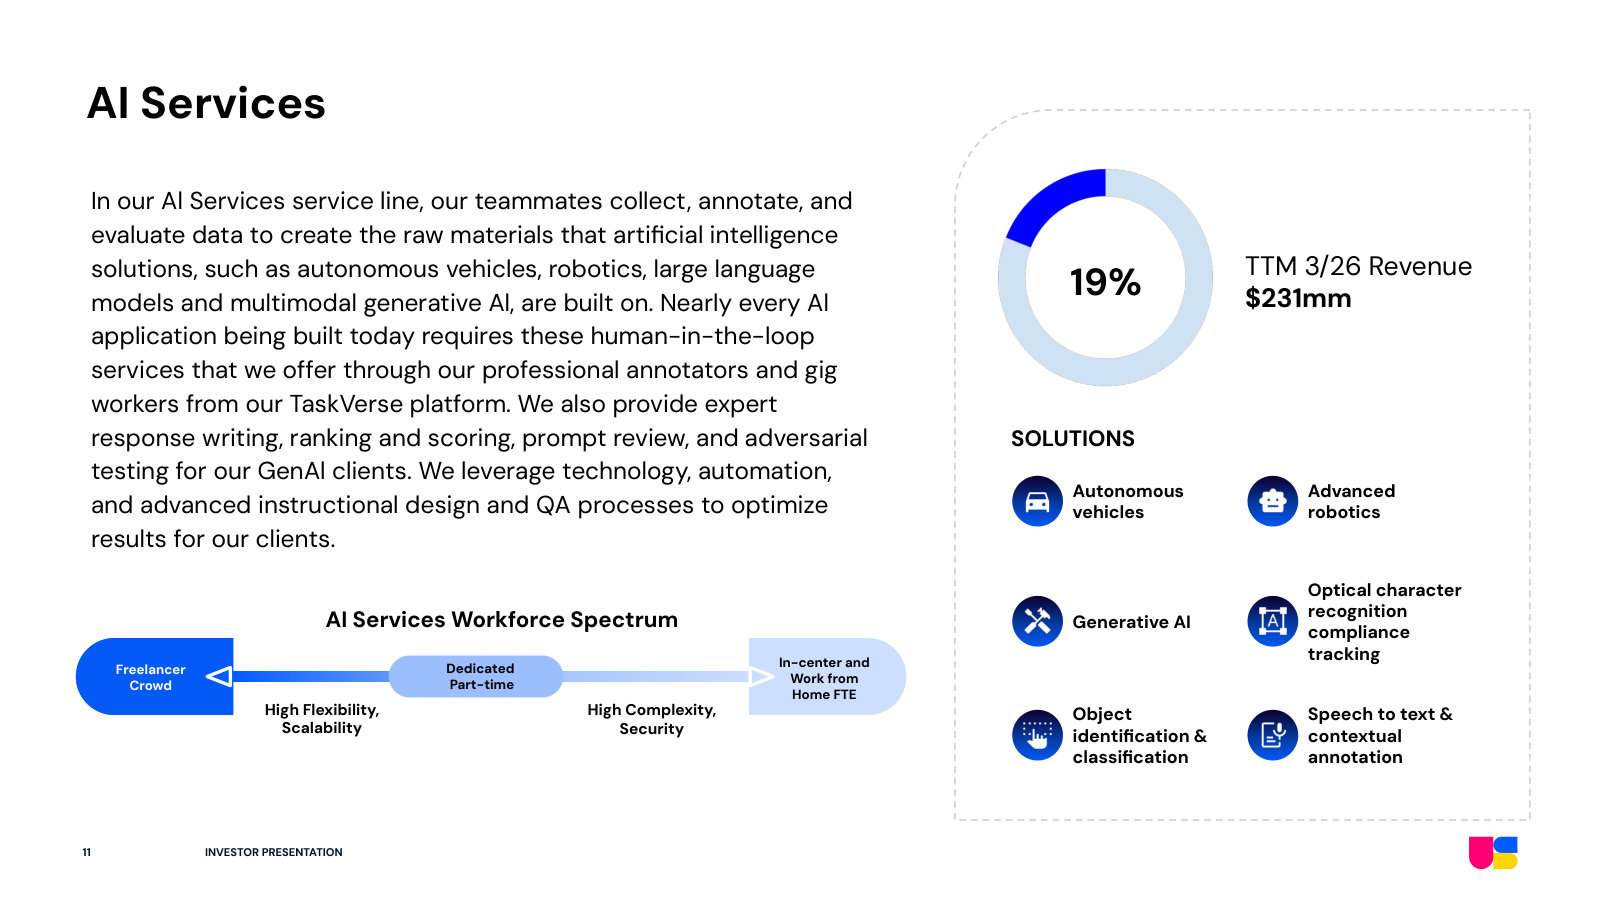
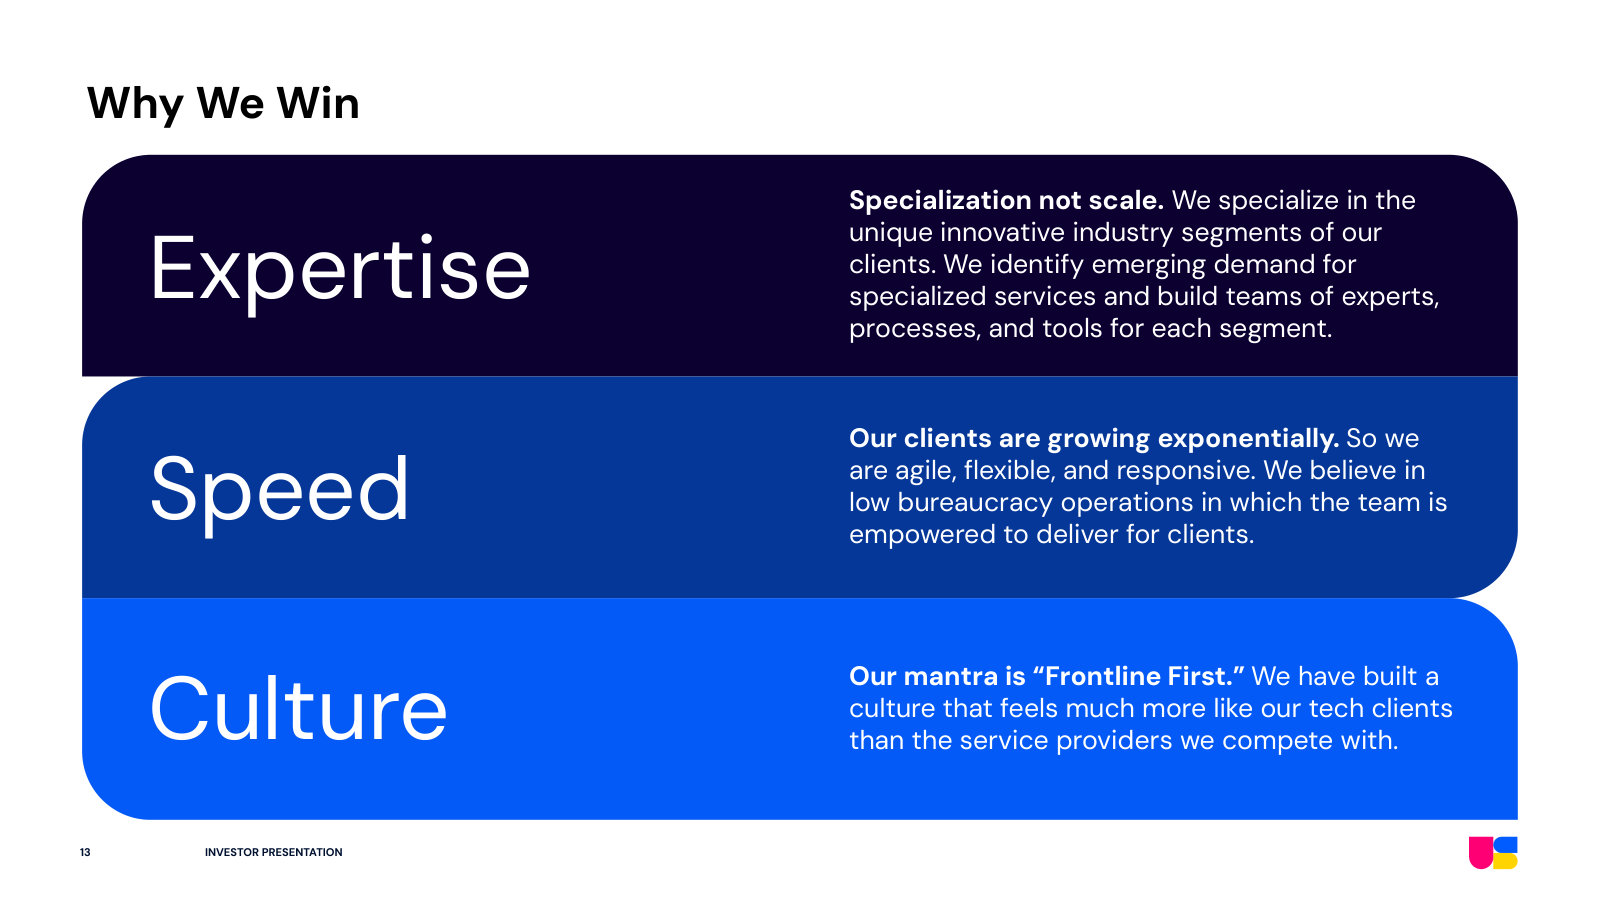
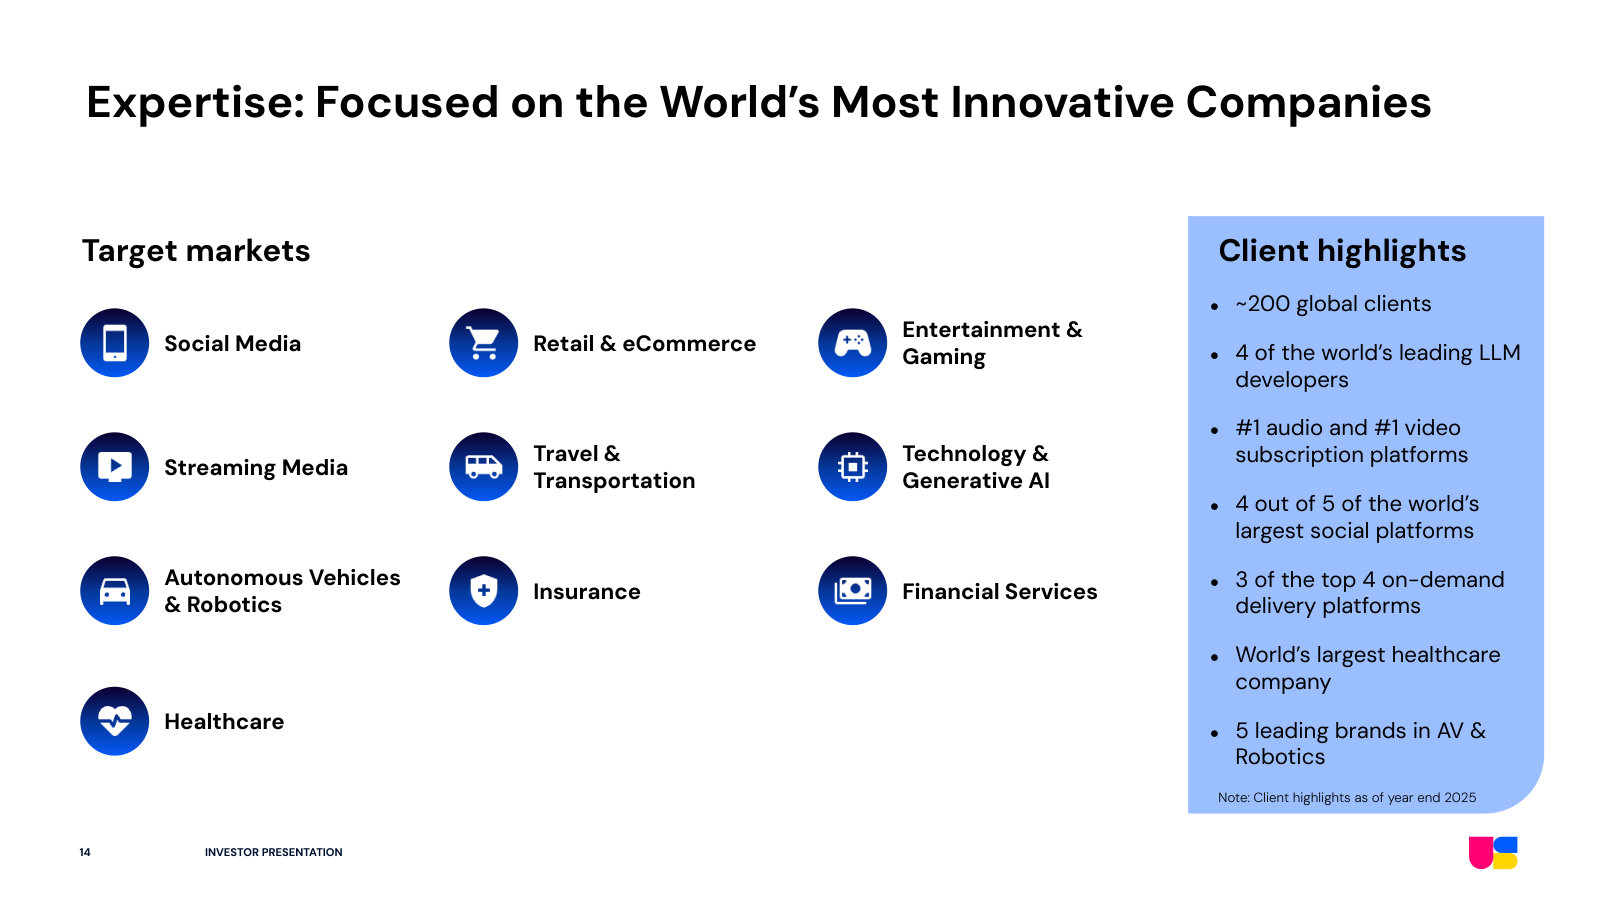
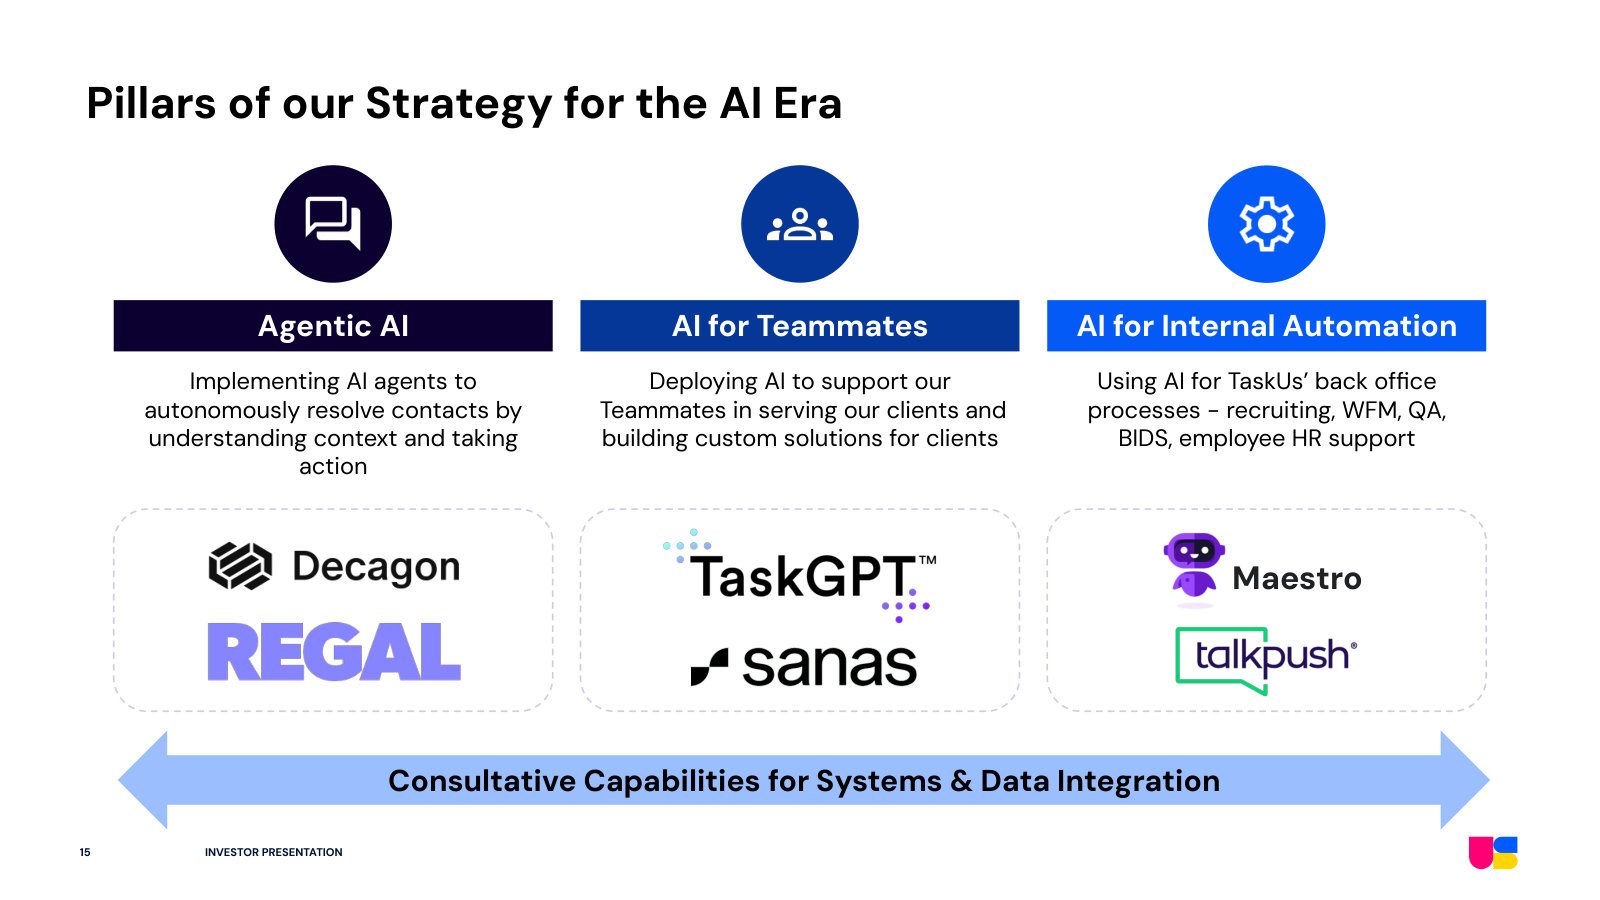
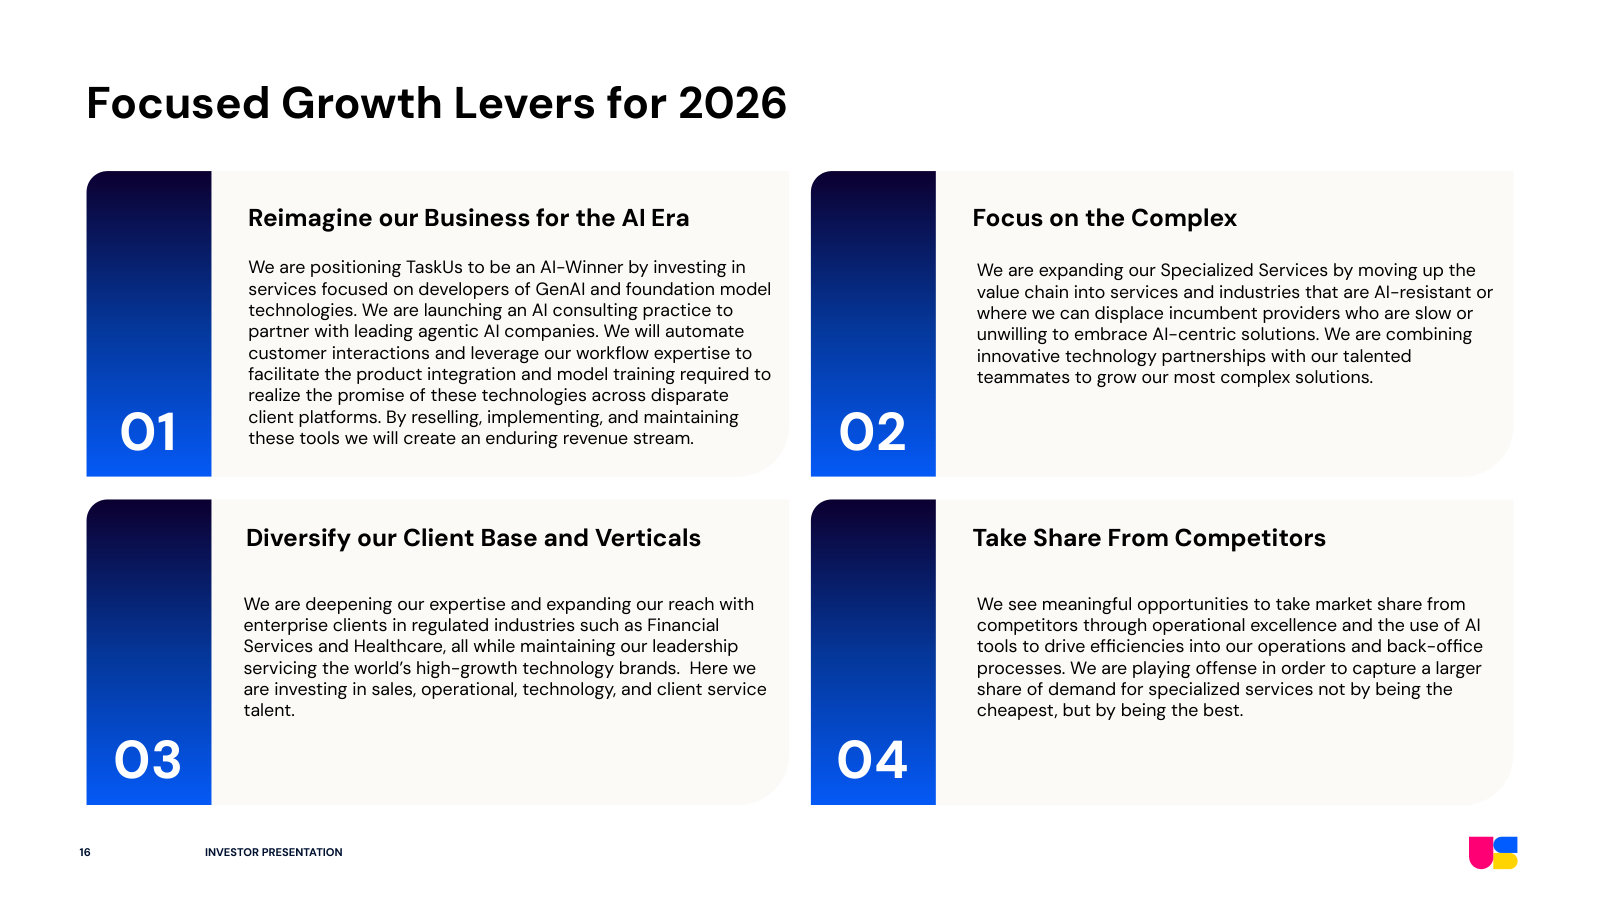
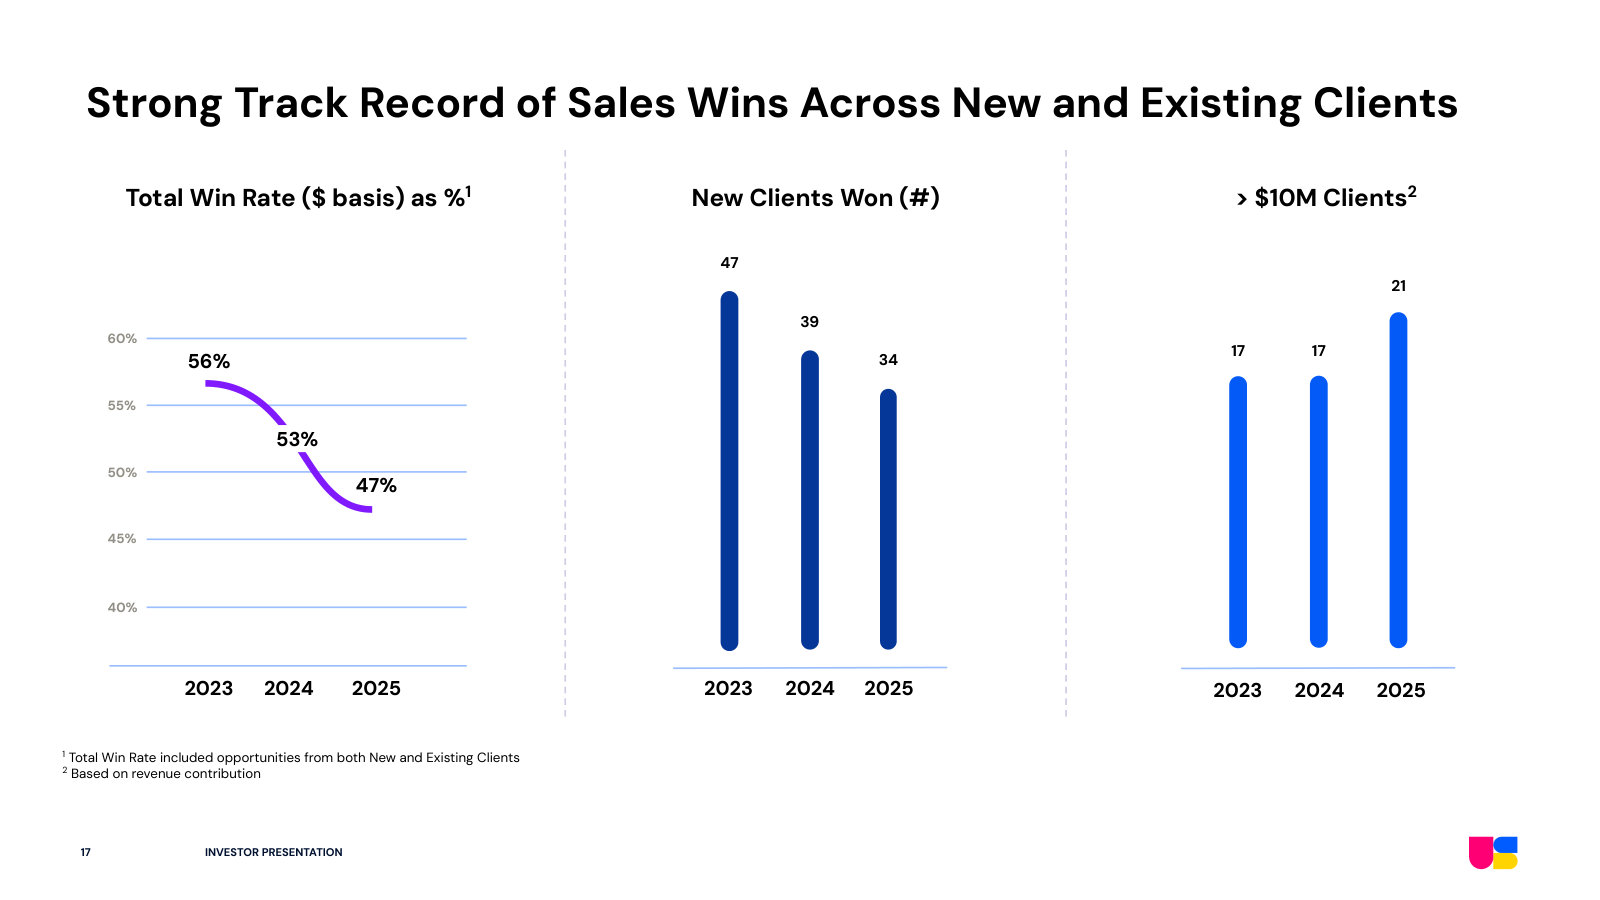
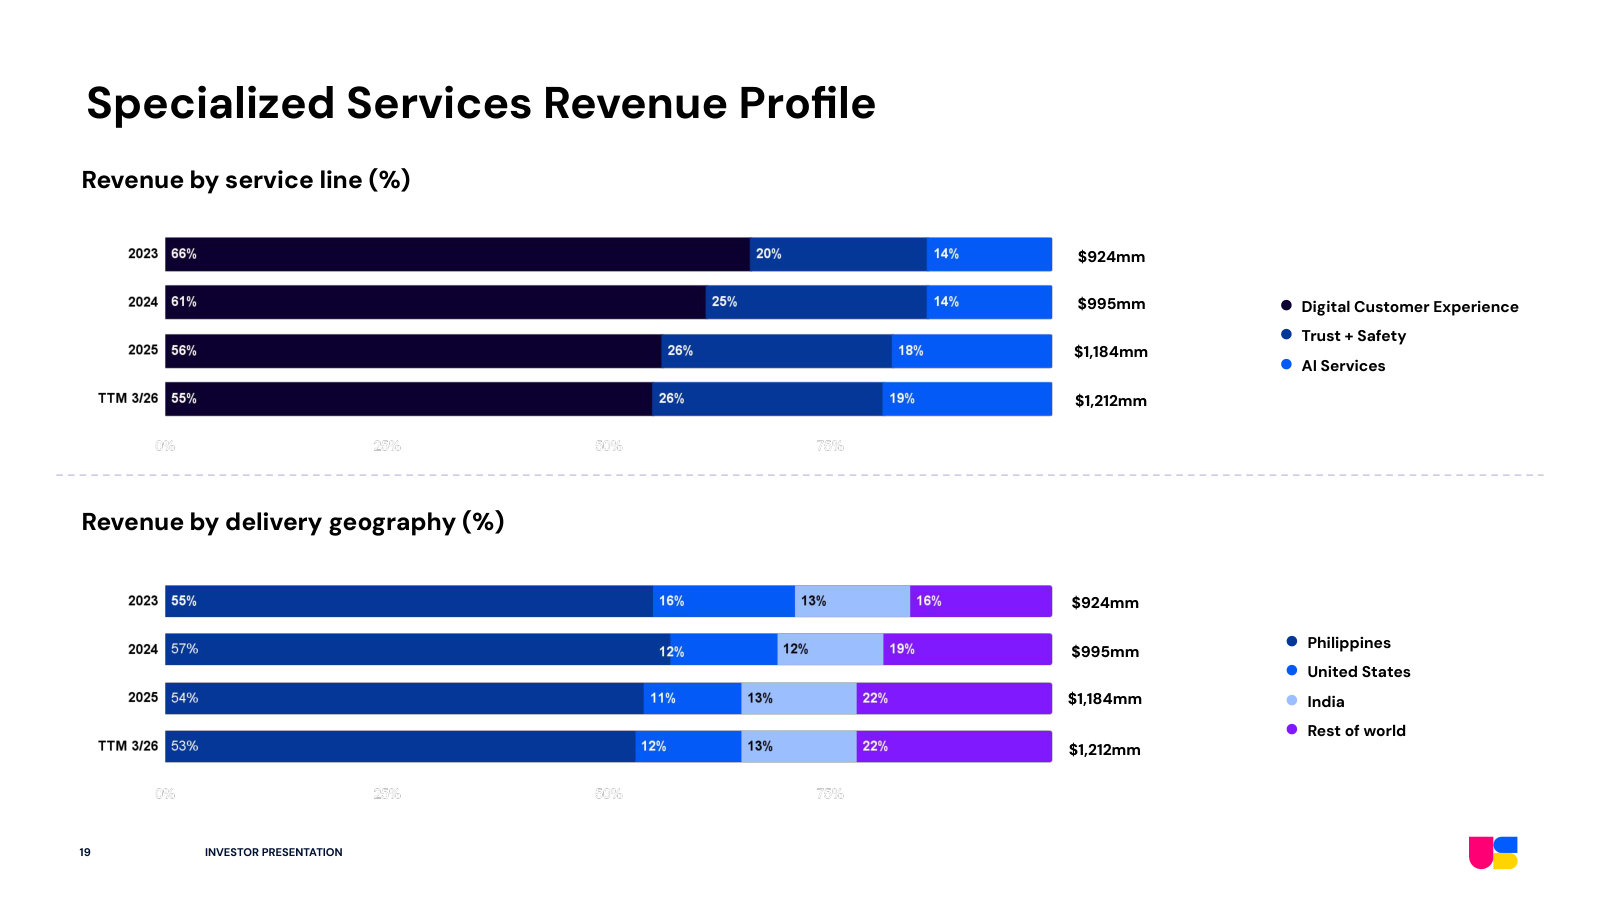
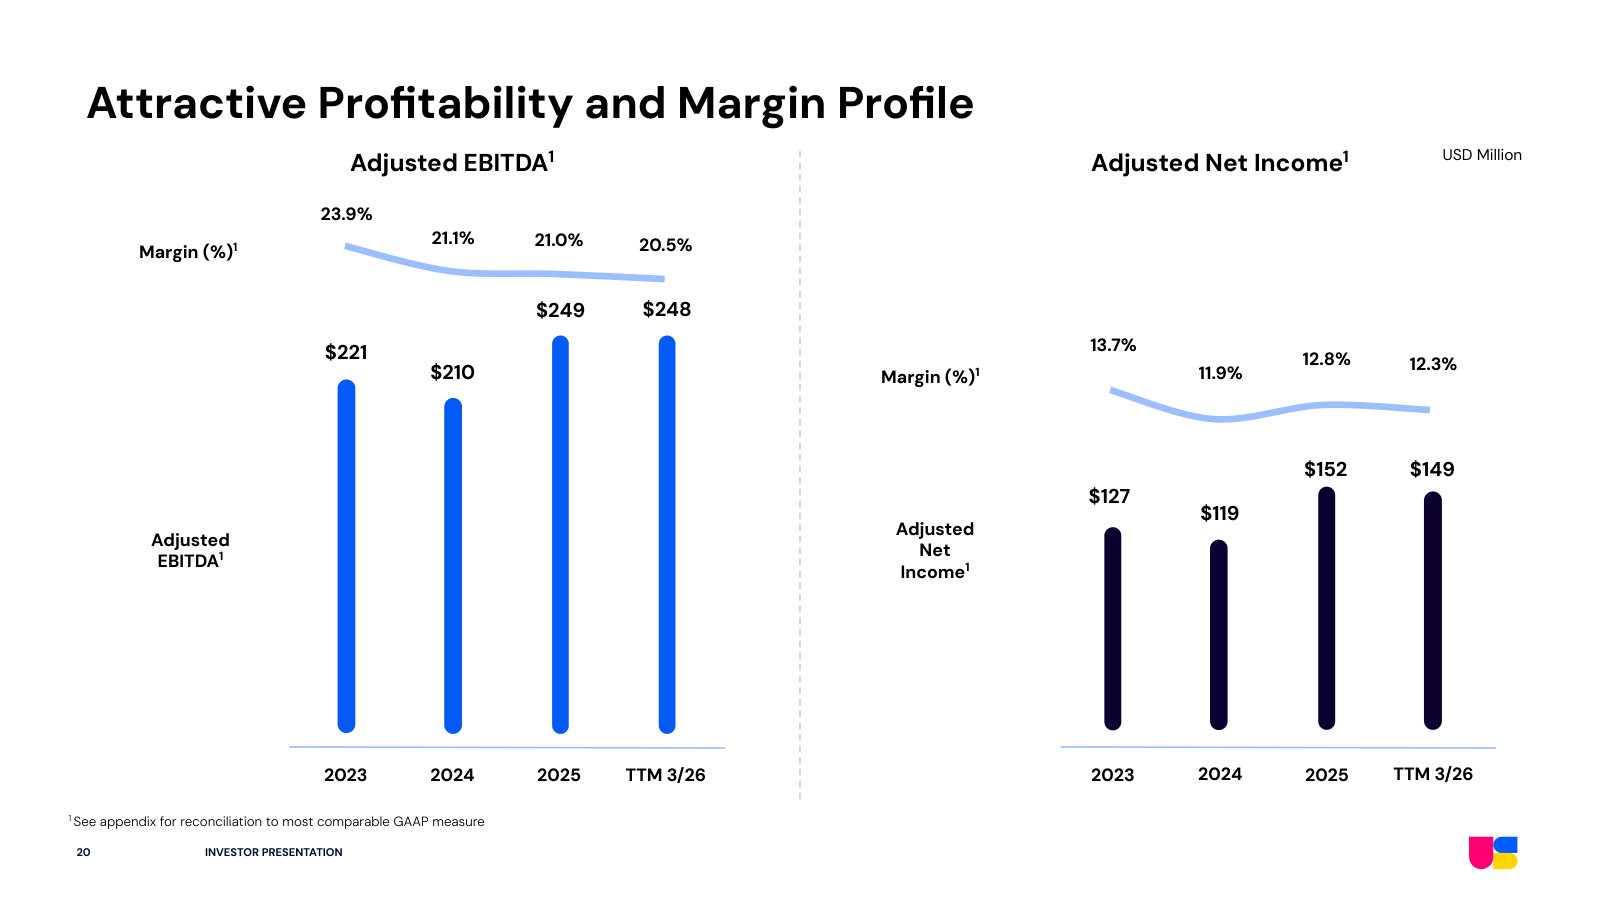
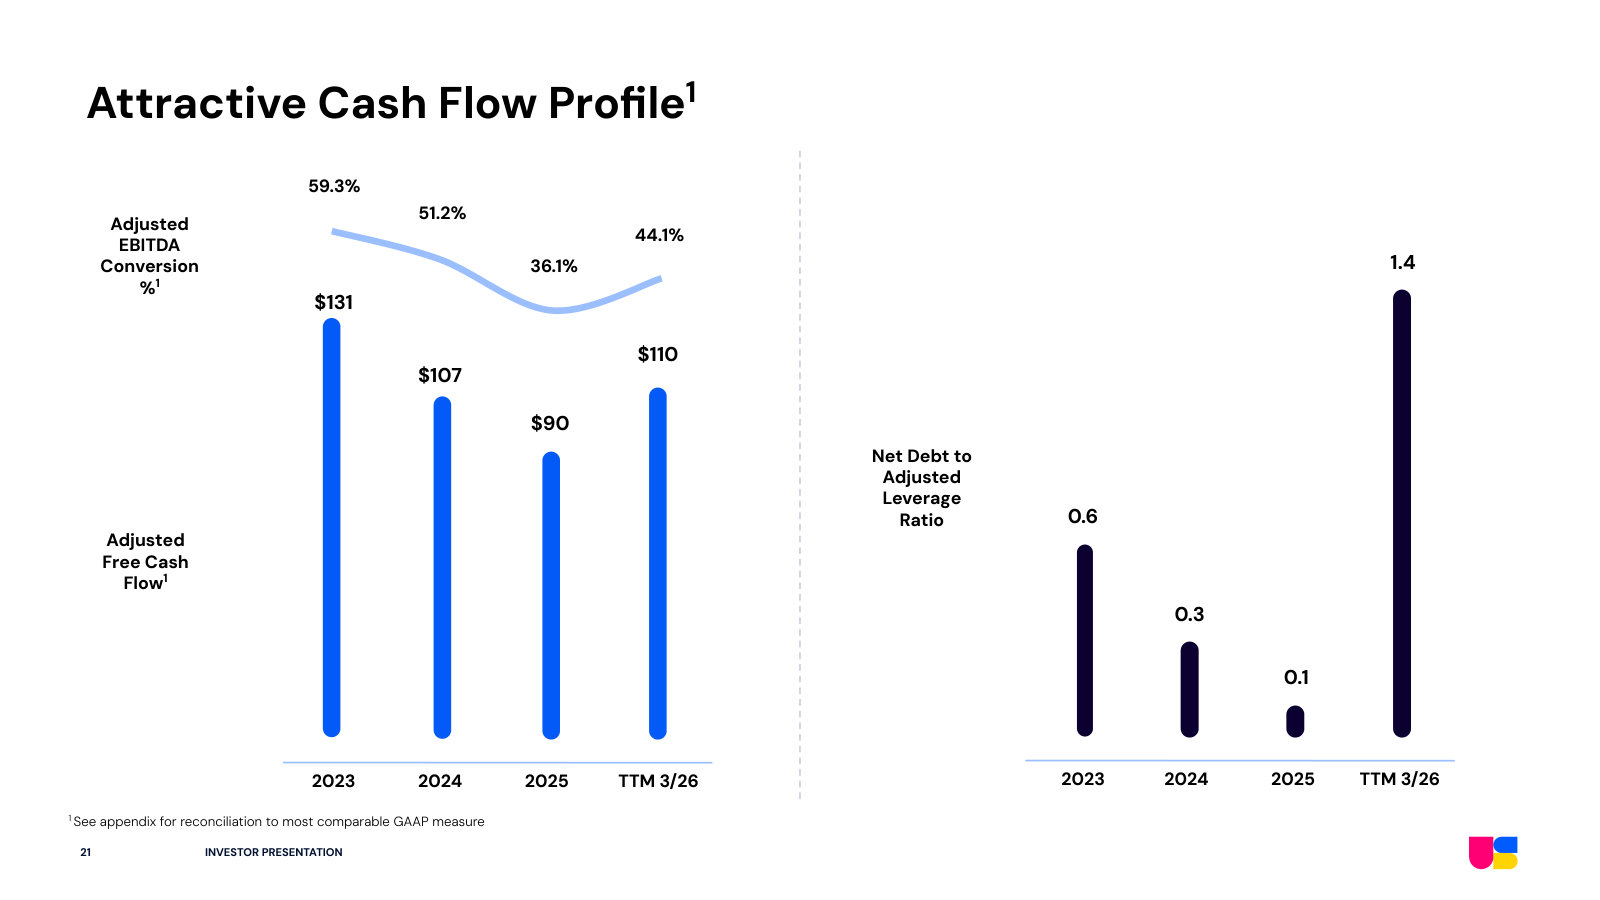
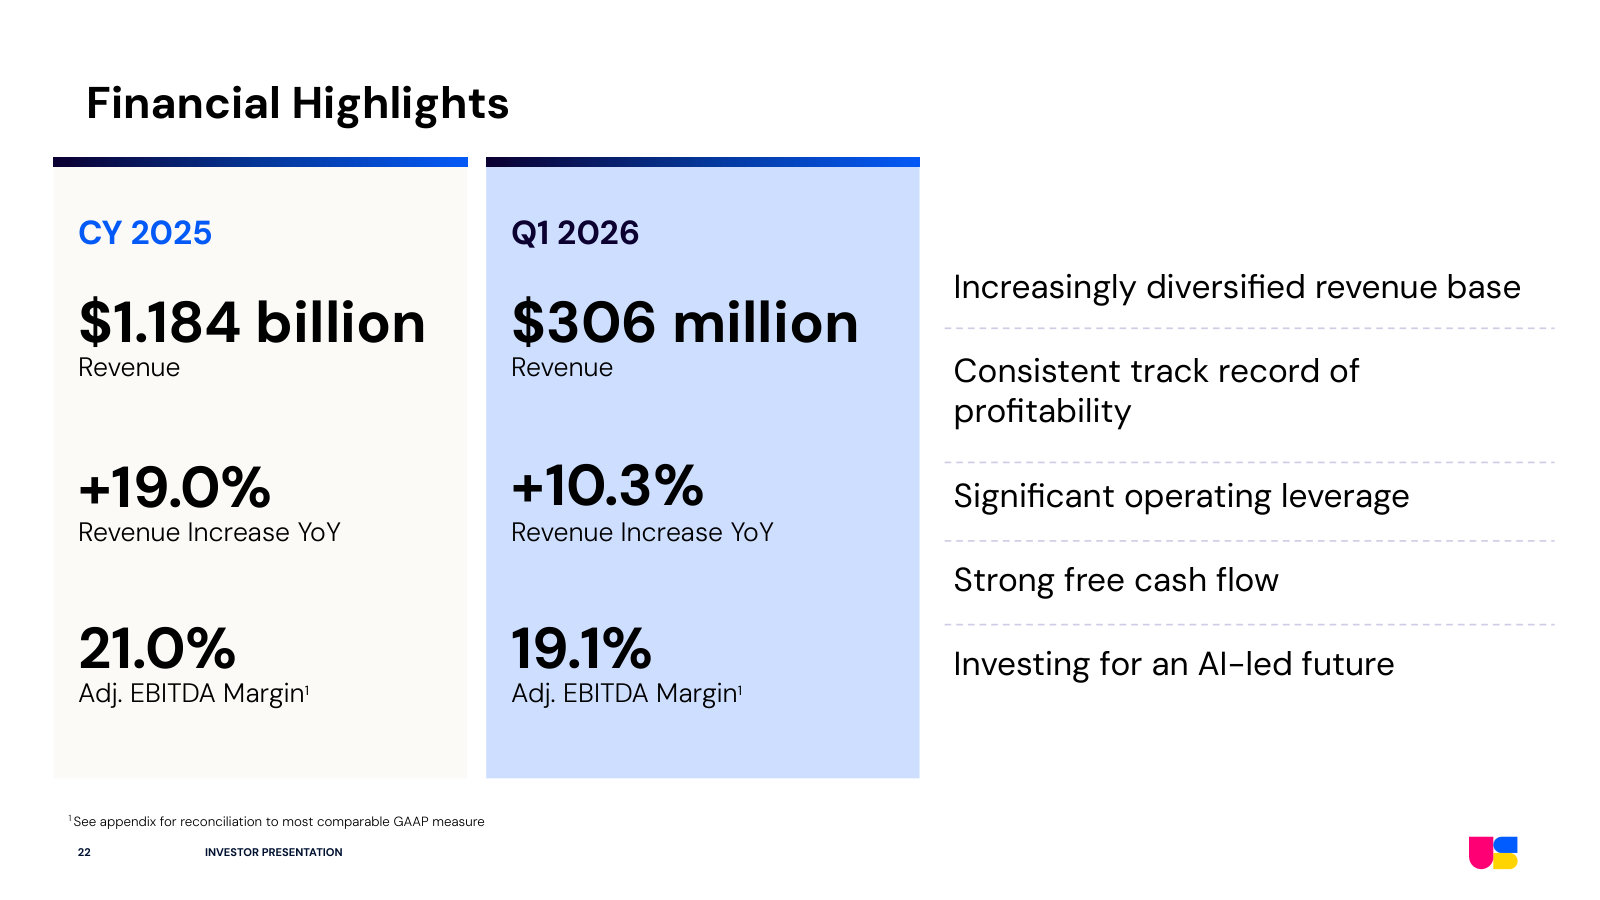
p. 3 — The one-slide intro: vision, the three service lines (DCX, Trust & Safety, AI Services), and the latest quarter's revenue and margin. · Open the full presentation →p. 7 — Delivery footprint — ~64,400 people across 31 sites in 13 countries, weighted to the Philippines, India, Colombia and Mexico. · Open the full presentation →p. 8 — How revenue splits across the three service lines — DCX 55%, Trust & Safety 26%, AI Services 19% (trailing twelve months). · Open the full presentation →p. 9 — Digital Customer Experience (55% of revenue, ~$670mm TTM): what omnichannel customer care covers and the offerings within it. · Open the full presentation →p. 10 — Trust & Safety (26%, ~$311mm TTM): content moderation plus financial-crime and compliance work, with the sub-services in each. · Open the full presentation →p. 11 — AI Services (19%, ~$231mm TTM): collecting, annotating and evaluating data for AI models, and the workforce model behind it. · Open the full presentation →p. 13 — Why management says it wins — expertise (specialization over scale), speed, and a 'Frontline First' culture. · Open the full presentation →p. 14 — The nine target verticals and the client roster — ~200 clients, including four leading LLM developers and top social platforms. · Open the full presentation →p. 15 — The AI-era strategy in three pillars — agentic AI, AI for teammates, AI for internal automation — and the partners behind each. · Open the full presentation →p. 16 — The four growth levers for 2026: reimagine for AI, focus on the complex, diversify clients and verticals, take share. · Open the full presentation →p. 17 — The sales engine — total win rate (56% falling to 47%), new clients won per year, and the count of clients over $10mm. · Open the full presentation →p. 19 — Revenue by service line and by delivery geography, 2023 to TTM — the mix and where the work actually gets done. · Open the full presentation →p. 20 — Profitability trend — adjusted EBITDA and adjusted net income with margins, 2023 through the latest TTM. · Open the full presentation →p. 21 — Cash and balance sheet — adjusted free cash flow, EBITDA conversion, and net-debt-to-EBITDA leverage by year. · Open the full presentation →p. 22 — The financial summary — FY2025 and Q1 FY2026 revenue, growth and adjusted EBITDA margin, side by side. · Open the full presentation →
Investor Presentation — Q4 FY2025 — Q4 FY2025 · 30 pages · The year-end FY2025 edition of the same deck — full-year 2025 results as management framed them at year-end, before the Q1 FY2026 refresh. · Open →
Investor Presentation — Q1 FY2024 — Q1 FY2024 · 32 pages · The earliest edition on file — pre-AI-era framing, when 'take share from competitors' led the growth story rather than the AI pivot. · Open →